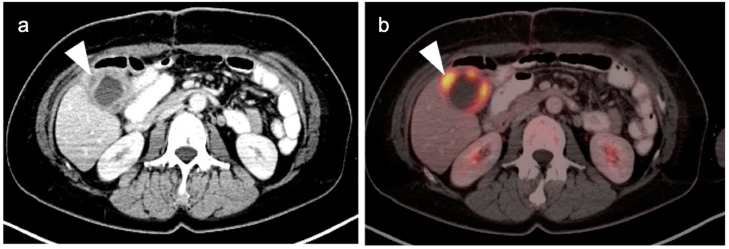
Figure 23.
Xanthogranulomatous cholecystitis. (a) Contrast-enhanced CT demonstrates gallbladder wall thickening with nodular hypoattenuating regions within the gallbladder wall (white arrowhead); (b) Axial FDG PET-CT shows focal increased metabolic activity in the hypoattenuating nodular regions within the gallbladder wall, due to accumulation of lipid laden macrophages in areas of chronic inflammation (white arrowhead).

