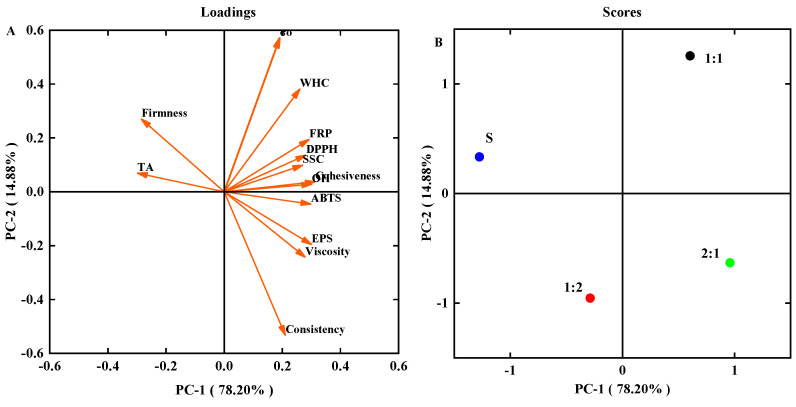
Figure 7.
Principal component analysis (PCA) of all data. (A) Loading plot indicating the correlation between variables (EPS, apparent viscosity, firmness, consistency, cohesiveness, survival counts of S. thermophilus, DPPH, ABTS, OH, FRP, pH, TA, and WHC), EPS content, and viscosity. (B) Score plot indicating sample distribution based on the formulation.

