Figure 1.
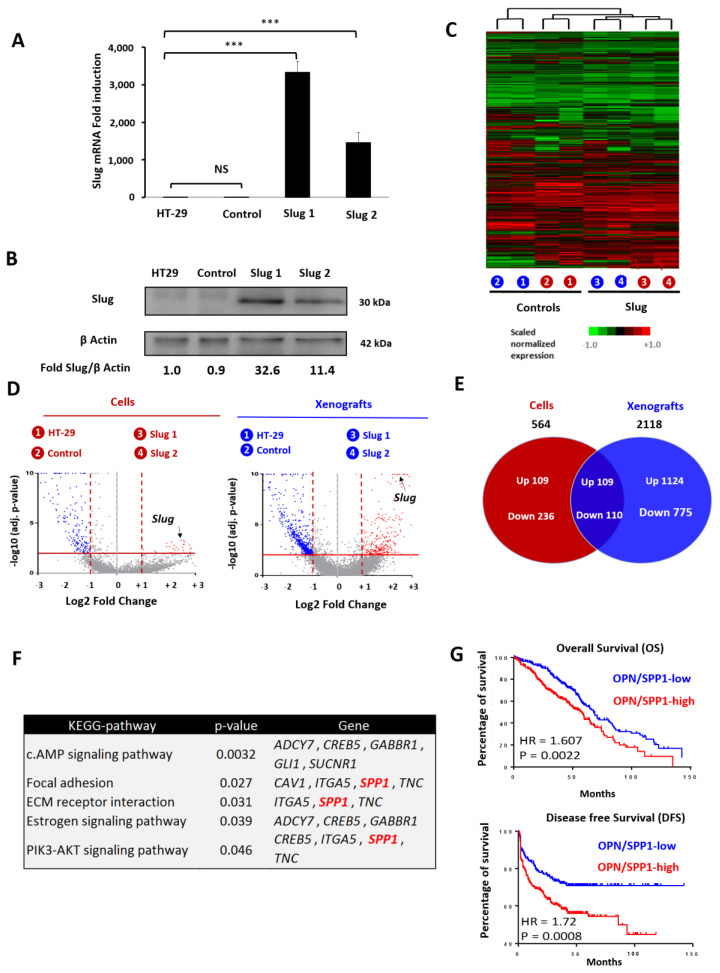
Influence of Slug/SNAI2 on global gene expression in CRC cells and tumors. (A) Expression of Slug mRNA in a genetic HT-29 model, including the parental HT-29 cells, the empty plasmid control and two stable Slug transfectants, Slug1 and Slug2. Symbols: *** p < 0.001 (B) Slug protein expression in the same four HT-29 models mentioned above. β-actin was used as loading control. (C) Heat map of the genes expressed by Slug1 and Slug2 cells and tumors compared to parental and control cells. Hierarchical clustering was performed by using the one minus Pearson correlation. Genes are considered to be significantly upregulated in the Slug transfectants, compared to controls, if the fold change (FC) is greater than 2, and considered to be downregulated if the FC is less than −2 with p-values (false discovery rates) less than 0.01. (D) Volcano plots showing the significant genes present in the indicated cells or tumors. Downregulated genes are depicted in blue, and upregulated genes in red, while Slug expression is indicated by a red arrow (log2 fold-change (FC) vs. –l-log10 p-value). (E) Venn diagrams of the number of up-or downregulated genes in cells, tumors, and in both groups. (F) KEGG-pathway enrichment analysis of the up-regulated genes. SPP1 encoding osteopontin (OPN) is part of the signature for focal adhesion, extracellular matrix (ECM)–receptor interaction, and the PI3K-AKT signaling pathway. (G) Kaplan–Meier curves of overall survival (OS) on the left and disease-free survival (DFS) on the right, based on the expression of OPN in a meta-cohort of 1820 CRC patients [7].

