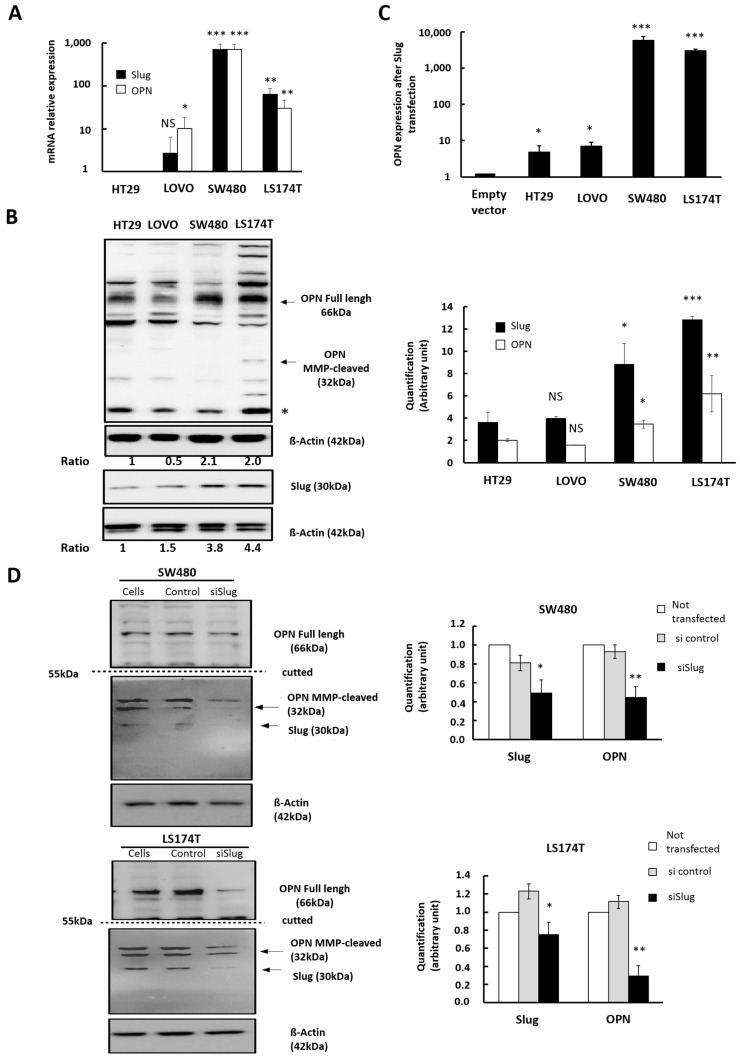
Figure 2.
Influence of Slug/SNAI2 on OPN expression in CRC cells with different genetic background. (A). Relative expression of OPN mRNA following transitory transfection of Slug as compared to empty vector for the 4 CRC cell lines (HT-29, LoVo, SW480, and L174T). The graph represents the mean of at least 3 independent experiments, and the error-bars represent the standard error (SEM). Data were considered significant if p was less than 0.05 as determined by the ANOVA test. Symbols: * p < 0.05, ** p < 0.01, *** p < 0.001, NS, not significant. (B) Western blot analysis of Slug and osteopontin proteins in HT-29, LoVo, SW480, and LS174T cells. (*) Extra band: putative 15 kDa cleaved form of OPN, full length OPN, MMP cleaved form of OPN. β-actin was used as loading control. (C) Relative expression of OPN mRNA following transitory transfected Slug-encoding expression vector compared to empty vector in the 4 CRC cell lines (HT-29, LoVo, SW480, and L174T). The graph represents the mean of at least 3 independent experiments, and the error-bar represent the standard error (SEM). Data were considered significant if p was less than 0.05 as determined by the ANOVA test. Symbols: * p < 0.05, ** p < 0.01, *** p < 0.001, NS, not significant. (D) Western blot analysis of Slug and osteopontin protein 48 h after transfection of the indicated cells with si control or with si Slug. β-actin was used as loading control. The histogram indicates the mean of 2 independent experiments. The bar shows the SD. Symbols: * p < 0.05, ** p < 0.01, *** p < 0.001.

