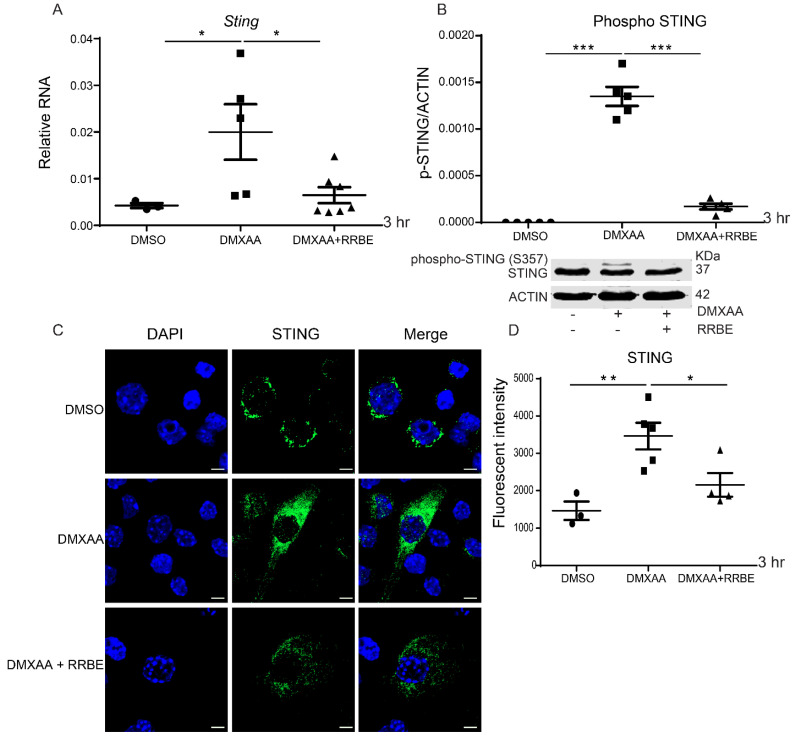
Figure 5.
Effects of RRBE on STING activation. (A) The mRNA expressions of Sting are shown (N = 3–4). (B) The cell lysates were extracted, and Western blotting was used to analyze STING and phospho–STING protein levels after DMXAA activation with and without RRBE for 3 h (N = 3–4). (C) Confocal microscope of the activated cells staining RAW 246.7 cells shows STING (green) and DAPI (blue) (scale bar, 10 µm). Representations of three experiments and (D) the fluorescent intensity of STING expressions are shown. Data shown as mean ± SEM (* p < 0.05, ** p < 0.01 and *** p < 0.001).

