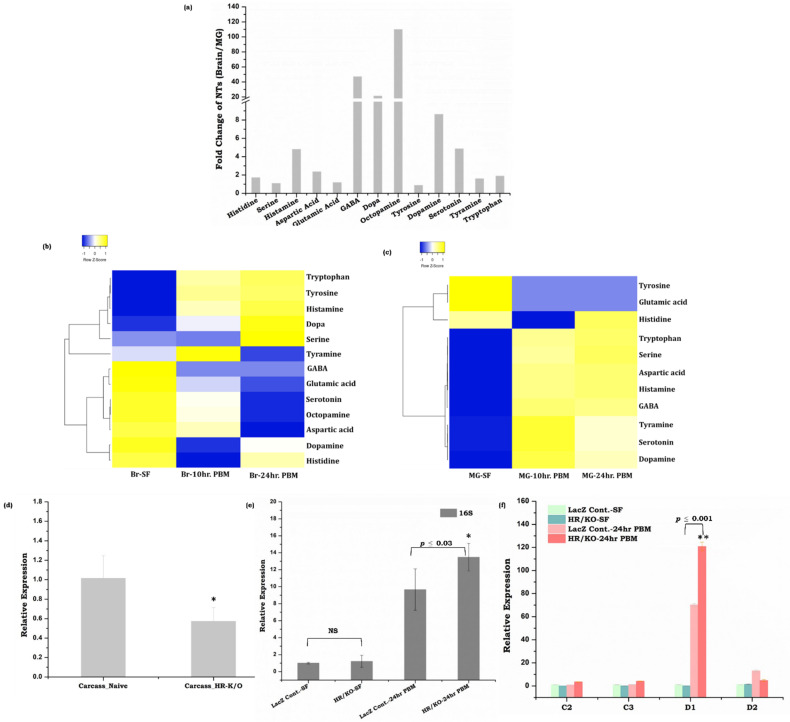
Figure 4.
Gut–Brain–Axis (GBA) communication and neurotransmitter (NT) estimation in mosquito An. culicifacies. (a) Comparative analysis of NT abundance in the naïve mosquitoes’ brain and midgut; (b) Heatmap showing the alteration of neurotransmitters level in mosquito brain tissue. NT levels were measured by LC-MS from the brains of naïve (sugar-fed) and blood-fed females (10 and 24 h PBM) (n = 65, N = 2). Statistically significant differences in the amount of metabolites were tested by p-values (p ≤ 0.005) that are deduced by two-way ANOVA and Tukey’s test; (c) Heatmap of neurotransmitters levels of mosquito gut tissue that vary during the metabolic switch. NT levels were measured by LC-MS from the gut of naïve (sugar-fed) and blood-fed females (10 and 24 h PBM) (n = 50, N = 2). Statistically significant differences in the amount of metabolites were tested by p-values (p ≤ 0.005) that are deduced by two-way ANOVA and Tukey’s test. (n = number of mosquitoes from which the respective tissue was dissected and pooled for each independent experiment; N = number of biological replicates); (d) AcHR silencing validation in the carcass of An. culicifacies mosquitoes (n = 10, N = 2) (p ≤ 0.01) (p ≤ 0.05 is indicated as ‘*’). (e) Relative expression of 16S transcripts in control and HR knockdown mosquitoes. (f) Transcriptional response of immune genes in control vs HR knockdown mosquitoes during naïve sugar-fed and blood-fed conditions. p ≤ 0.005 is indicated as ‘**’, p ≤ 0.05 is indicated as ‘*’. C1: Cecropin 1, C2: Cecropin 2, D1: Defensin 1, D2: Defensin 2. Statistically significant differences for the silencing experiments are deduced by Students’ t-Test.

