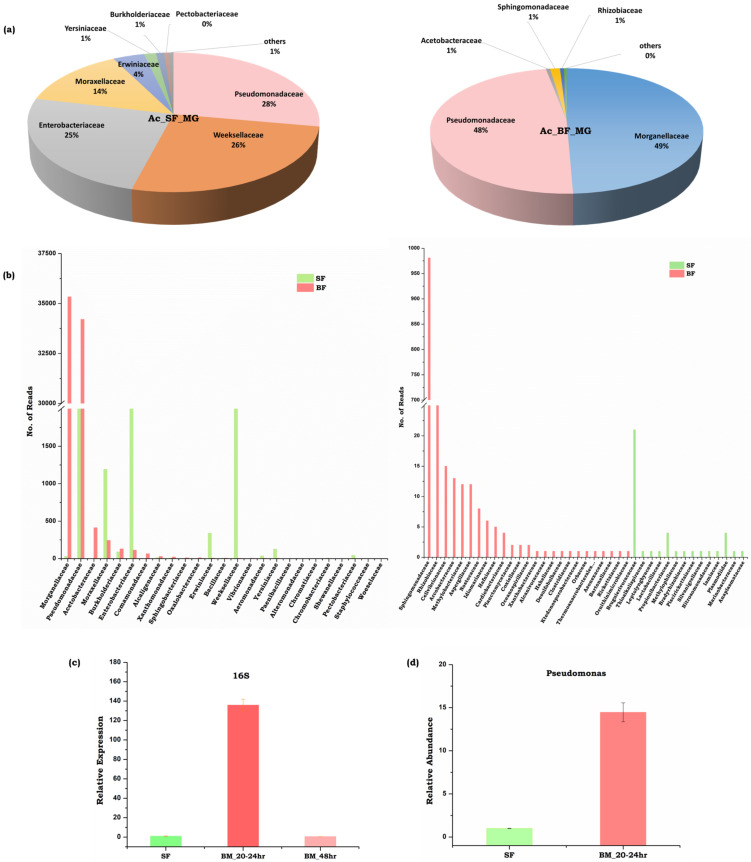
Figure 5.
Comparison of gut-metagenomes in the naïve sugar-fed and blood-fed mosquito Anopheles culicifacies: (a) Pie charts representing the major bacterial families under the two feeding status (b) Number of reads based comparative bar graphs showing common and unique families microbes (c) Relative quantitative distribution of microbiota based on 16SrRNA based expression in the midgut of An. culicifacies in response to sugar and post blood feeding (20–24 h PBM, 48 h PBM); (d) Relative abundance of Pseudomonas sp. bacteria in sugar-fed and blood-fed (20–24 h PBM) condition.

