
FIGURE 3.
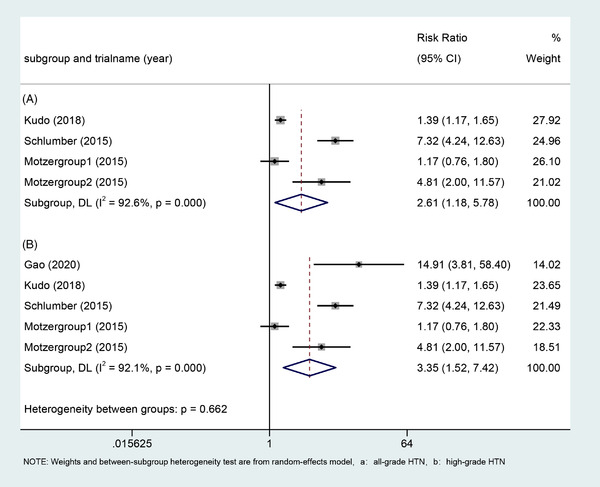
Forest plots of the relative risk of all‐grade hypertension and high‐grade hypertension and 95% CI in Lenvatinib‐treated patients
Official websites use .gov
A
.gov website belongs to an official
government organization in the United States.
Secure .gov websites use HTTPS
A lock (
) or https:// means you've safely
connected to the .gov website. Share sensitive
information only on official, secure websites.
Forest plots of the relative risk of all‐grade hypertension and high‐grade hypertension and 95% CI in Lenvatinib‐treated patients