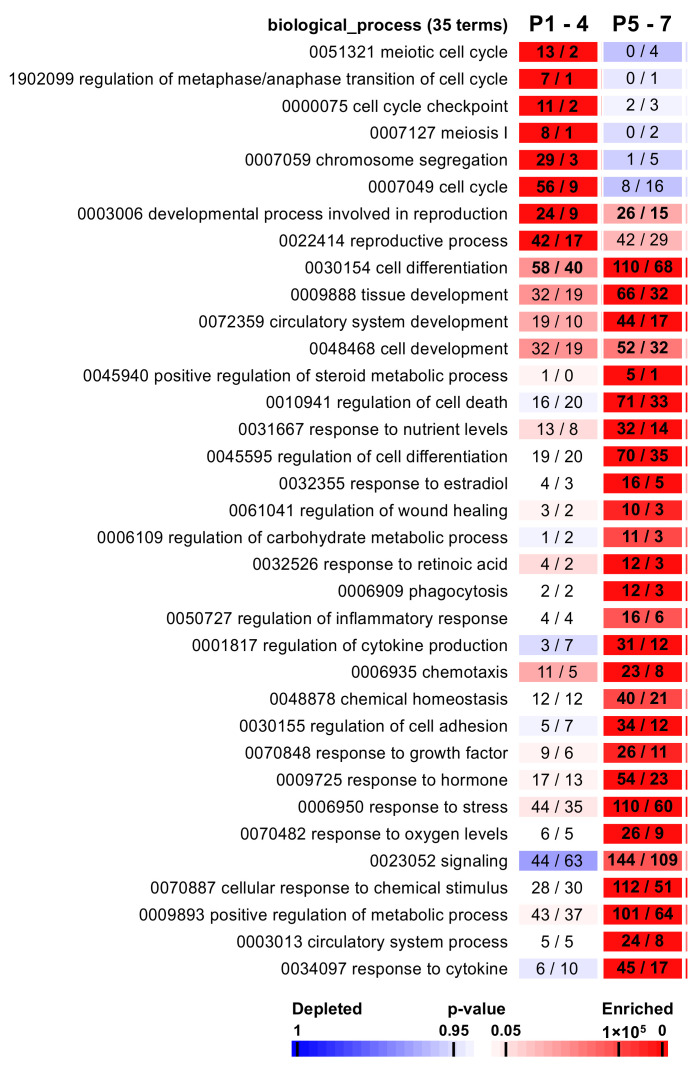
Figure 4.
Gene ontology enrichment in cultured testicular tissues. Each cluster is matched with a selection of enriched GO terms from the ontologies “biological process” and “cellular component”. Significantly enriched “biological process” terms and their identification numbers are given, followed by the total number of genes associated with the term and the numbers of genes observed vs. expected by chance. Significant GO terms for each pattern were highlighted with bold values. A color code indicates overrepresentation (red) and underrepresentation (blue) as indicated in the p value scale bar.

