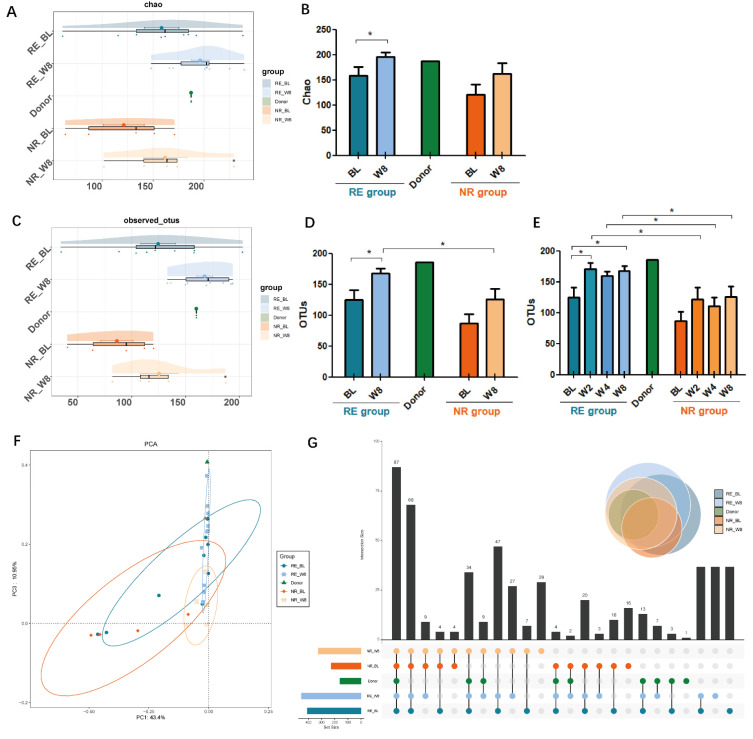
Figure 3.
Changes in intestinal microbiota diversity in responders (RE) and non-responders (NR) groups at baseline (BL) and week 8 (W8). (A,B) α-diversity reflected by chao index. (C,D) α-diversity reflected by observed community operational taxonomic units (OUTs). (E) OUTs at multi-time points. (F) β-diversity reflected by principal component analysis (PCA). (G) Venn diagram showing the number of unique and common OUTs in donor and FMT groups. (* p < 0.05).

