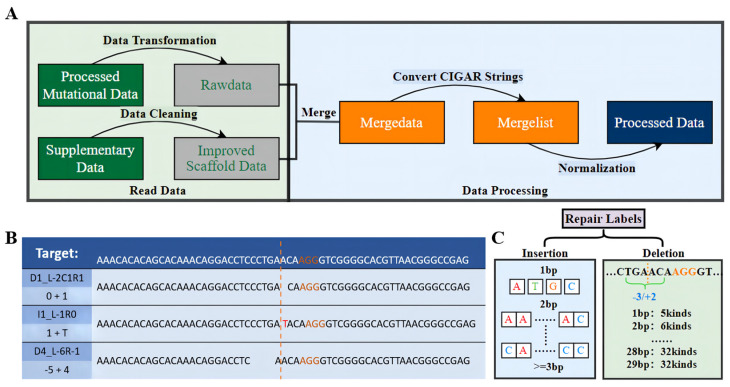
Figure 1.
Overview of data preprocessing. (A) Data preprocessing process from left to right. (B) Example of conversion of CIGAR strings. The yellow dashed line indicates the cut site, the yellow font represents the PAM, the top is the DNA sequence of the editing target, and the bottom is the repair labels corresponding to the three mutational outcomes. (C) The 557 repair labels, including insertions and deletions.

