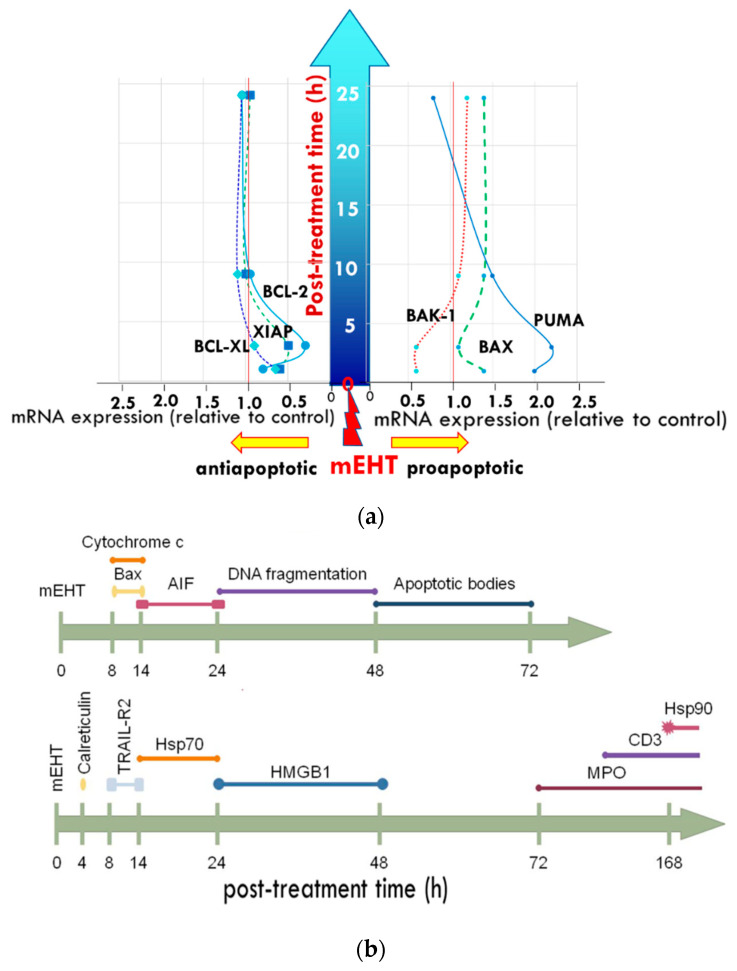
Figure 19.
The time scale of the apoptotic processes: (a) development of pro-and anti-apoptotic proteins on the first day (24 h) post-treatment; (b) further developments with cellular reactions visible until the end of the apoptotic process (48 h post-treatment) and the immune reactions that follow three days after treatment.

