Figure 6.
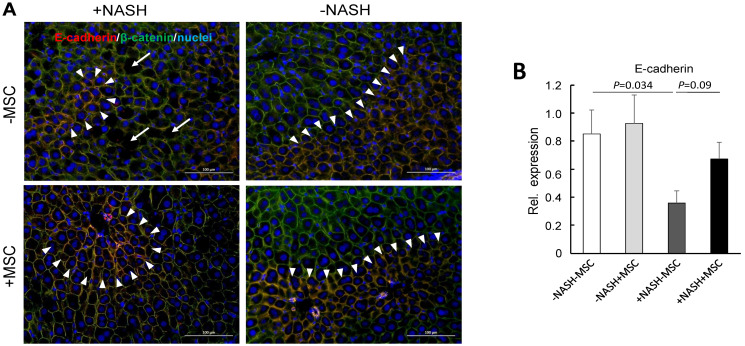
MSC treatment restores tissue homeostasis in livers of high-fat-diet-fed mice; (A) E-cadherin (red) and β-catenin (green) were detected by fluorescent immunohistochemistry in liver slices from animals either fed the high fat diet (HFD) or not (ND); where indicated, mice were treated with human MSC (+MSC) or left untreated (−MSC); pictures are representative for 3 different animals out of each group (orig. magnification: 20×; Scale bar—100 µm); white arrowheads demarcate zonal co-expression of E-cadherin and β-catenin (yellow = red/green overlay) in periportal hepatocytes, while β-catenin is expressed pan-parenchymally; blue, nuclear stain with DAPI. White arrows indicate “holes” of lipid deposition in the NASH livers; (B) quantification of E-cadherin mRNA abundance by sqRT-PCR; expression was normalized to the expression of β2-microglobulin used as a housekeeping gene; values are means ± SEM from 3 (ND − MSC), 4 (ND + MSC), 6 (HFD − MSC) and 6 (HFD + MSC) animals per group; one-way ANOVA and LSD post hoc test to calculate significance between groups.

