Figure 8.
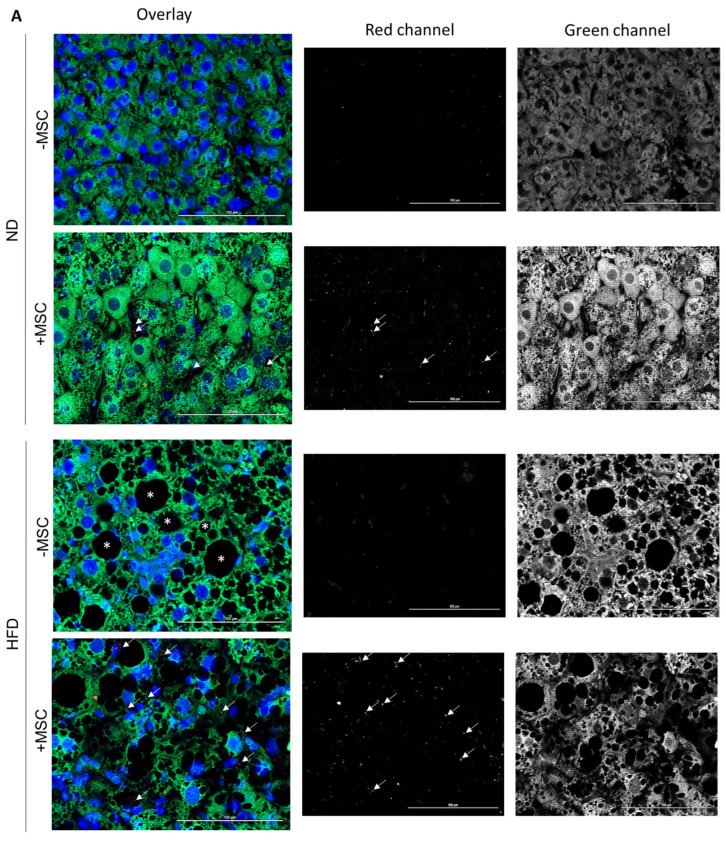
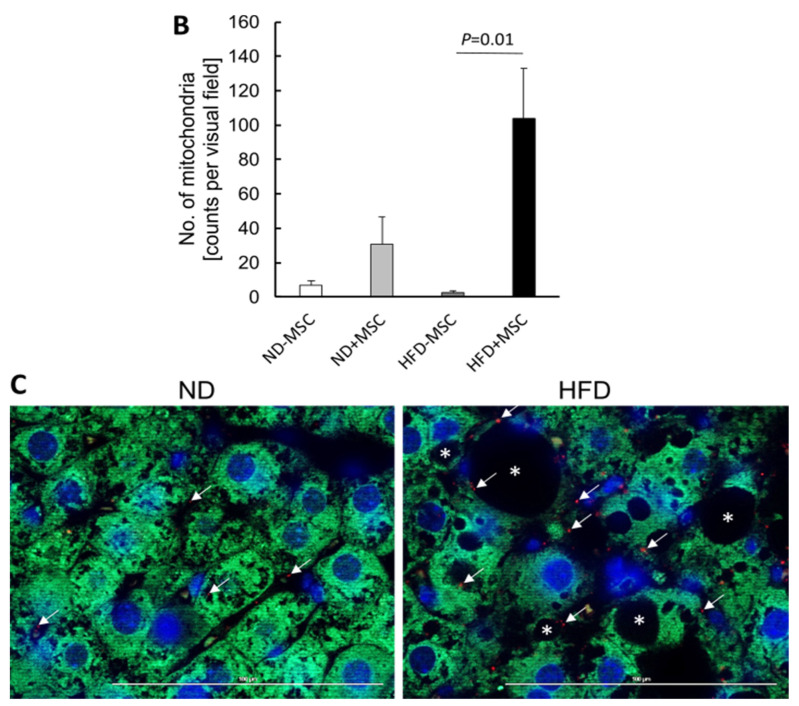
Human mitochondria derived from transplanted hBM-MSC in mouse hepatocytes. Mice fed the control (ND) or the high fat diet (HFD) were either treated (+MSC) or not (−MSC) with human bone-marrow-derived MSC. (A) Mouse cyclophilin (green in left column (overlay); white/grey in right column (green channel)) and human mitochondria (red in left column (overlay); white/grey in middle column (red channel)) were detected by immunofluorescence on liver tissue slices using species-specific antibodies. Images were taken with the Zeiss Axio Observer.Z1 microscope with ApoTome.2 at a 40× objective magnification. White arrows mark human mitochondria in livers receiving human MSC. Livers without MSC transplants did not display signals. Nuclei were stained with DAPI (blue). Asterisks label lipid droplets in livers of animals fed the high fat diet. Pictures are representative for livers from 2–3 animals in each group. (B) Quantitative image analysis of pictures shown representatively in (A). Values are mean counts ± SEM from 5 visual fields each on slices from 2 different animals in the (ND − MSC), (ND + MSC), (HFD − MSC) and from 7–8 visual fields each on slices from 3 different animals in the (HFD + MSC) group, respectively. Visual fields were analyzed using the ImageJ software as described under Materials and Methods. Statistics were calculated with SPSS 23. After evaluation of standard distribution, the Kruskal–Wallis algorithm and post hoc Bonferroni were applied for calculation of significance. (C) Representative images displaying the co-localization of mouse cyclophilin (green) and human mitochondria (red) in hepatocytes of mice receiving MSC transplants either fed the control diet (ND) or the high fat diet (HFD). Procedures were as described in (A) except that images were taken at the 63× objective magnification. Scale bars—100 µm.


