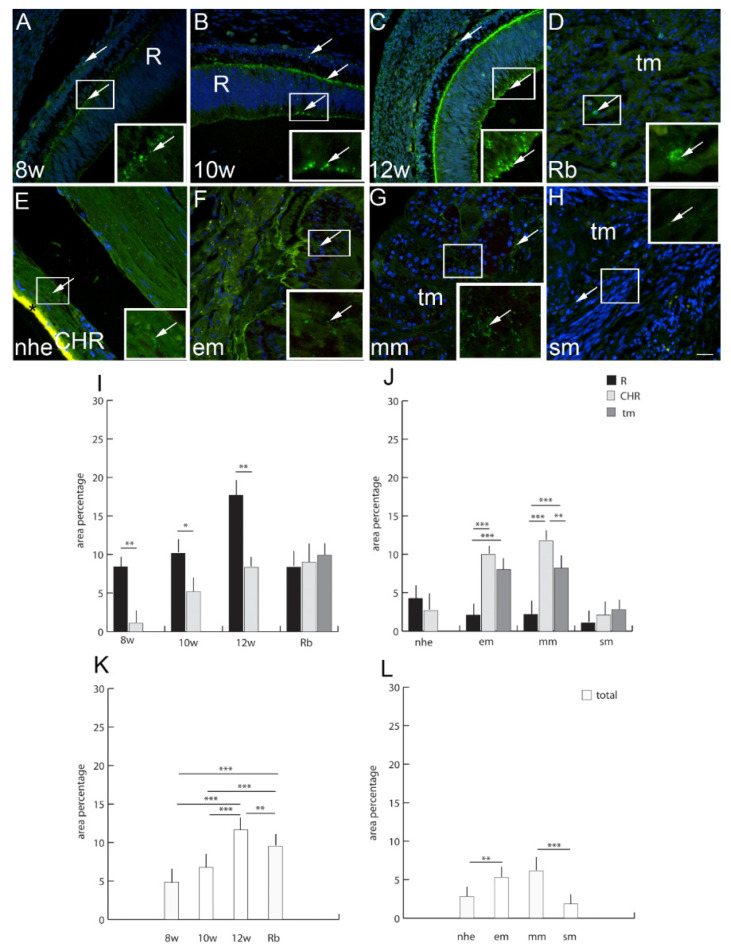
Figure 4.
Connexin 43 (Cx43)-positive cells (arrows) can be seen in the eye section of an 8th-week (8 w) (A), 10th-week (10 w) (B) and 12th week (12 w) (C) human embryo, retinoblastoma (Rb) (D), normal human eye (nhe) (E), epitheloid melanoma (em) (F), mixoid melanoma (mm) (G) and spindle melanoma (sm) (H); R—retina, CHR—choroidea, tm—tumor tissue, *—autofluorescence. Immunofluorescence staining to Cx43 (green) merged to DAPI (blue nuclei), scale bar 25 μm. The panel with graphs represents the area percentages of Cx43 in the retina (R), choroid (CHR) and tumor (tm) in the 8th-week (8 w), 10th-week (10 w) and 12th-week (12 w) human embryo, retinoblastoma (Rb), normal human eye (nhe), epitheloid melanoma (em), mixoid melanoma (mm) and spindle melanoma (sm) (I,J), and total area percentage of Cx43 (K,L). Data are shown as mean ± SD. Significant differences are indicated by * p < 0.05, ** p < 0.01, and *** p < 0.001. One-way ANOVA followed by Tukey’s multiple-comparisons test (comparison between Rb and uveal melanoma types), t-test (comparison between retina and choroid of developmental stages and normal human eye).

