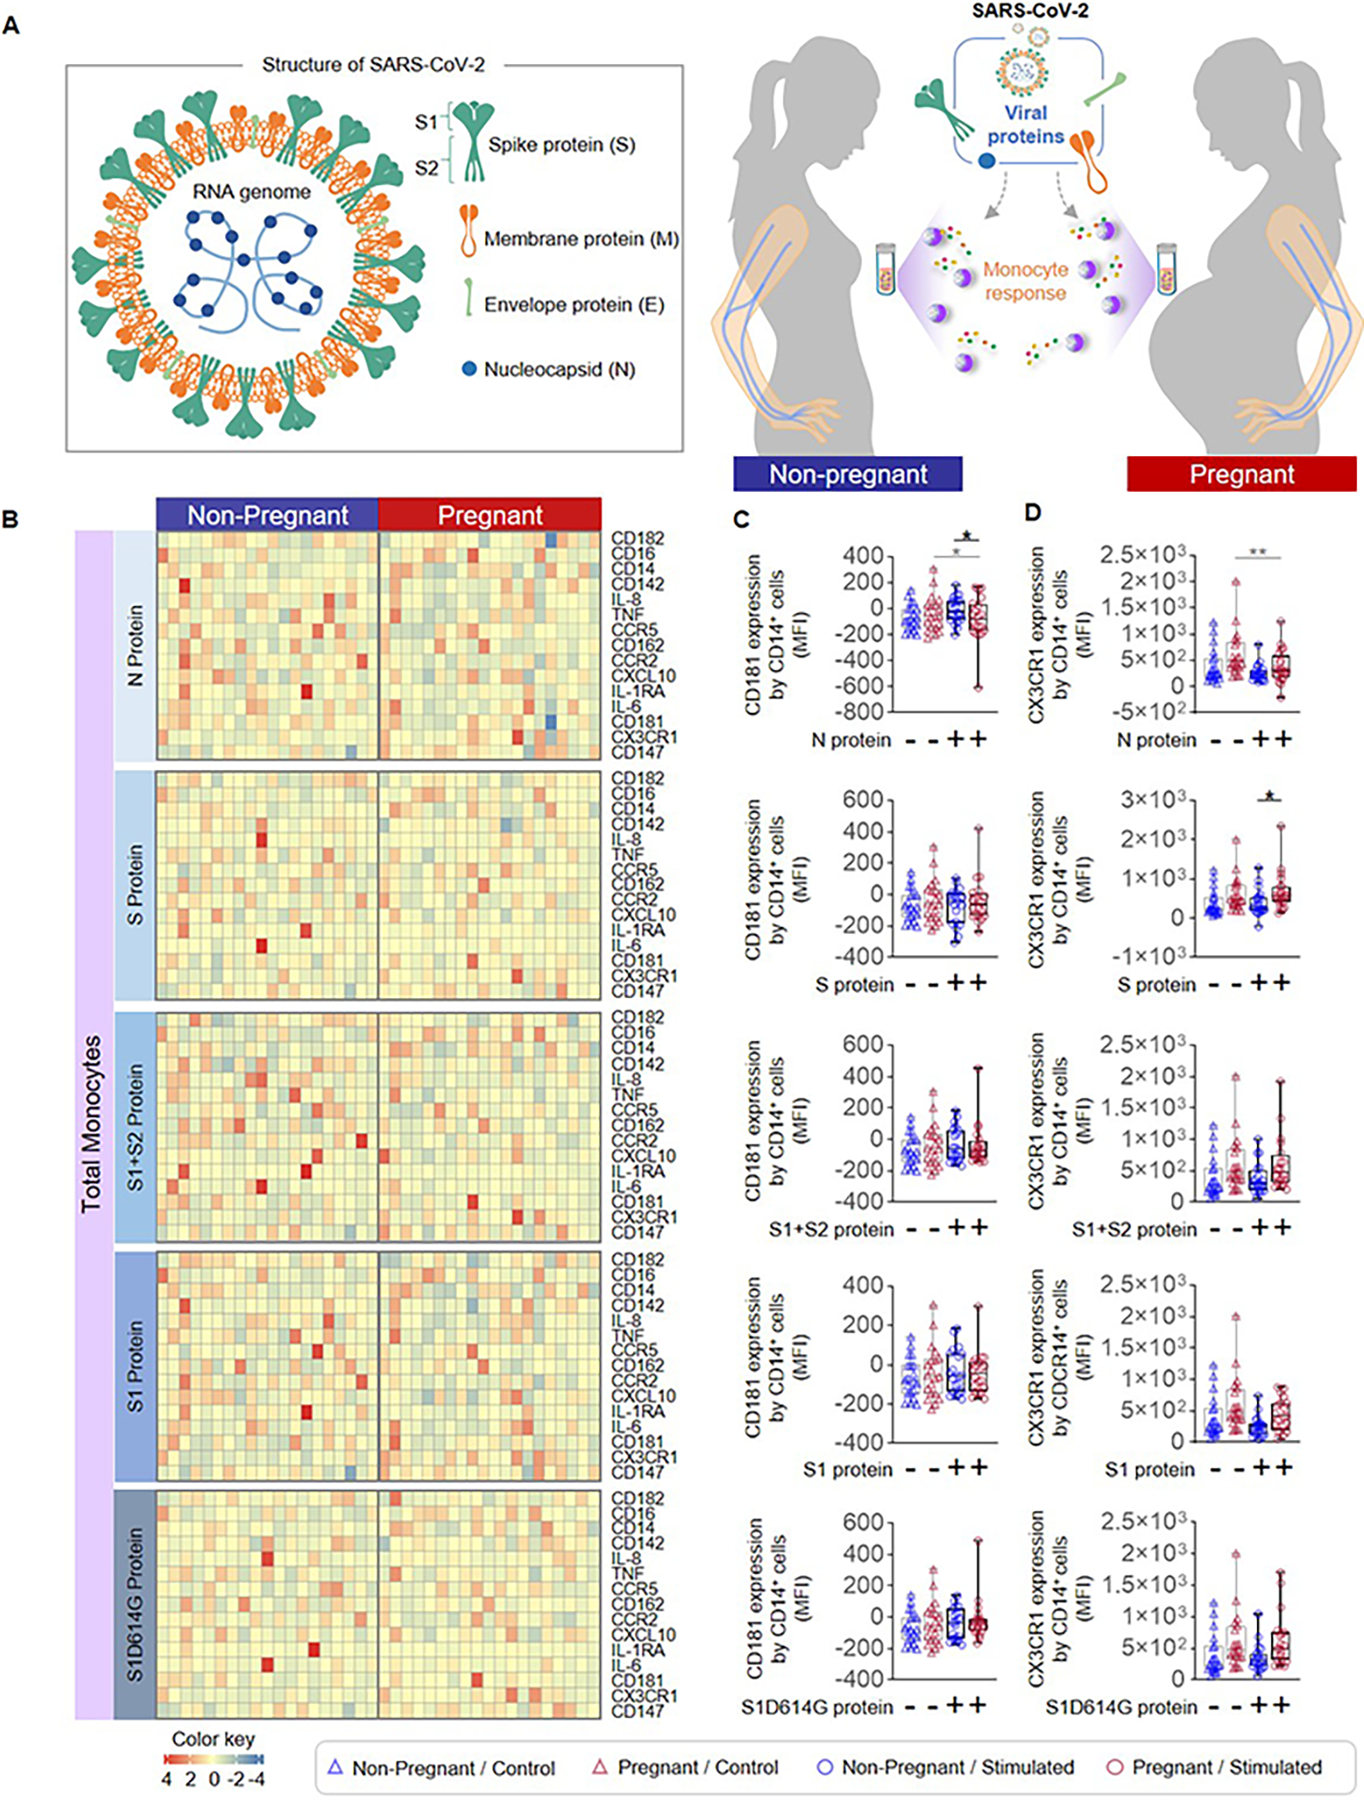
Figure 2. Total monocyte response to SARS-CoV-2 proteins in pregnant and non-pregnant women.

(A) (Left) Schematic representation of SARS-CoV-2 structure showing the spike (S), membrane (M), envelope (E), and nucleocapsid (N) proteins as well as the S protein subunits S1 and S2. (Right) Peripheral blood samples were collected from non-pregnant (n = 20, indicated in blue) and pregnant (n = 20, indicated in red) women to isolate peripheral blood mononuclear cells (PBMCs) for in vitro stimulation with SARS-CoV-2 proteins. Flow cytometry was performed to determine the expression of activation markers by total monocytes. (B) Heatmap representations showing expression of activation markers by total monocytes after stimulation with SARS-CoV-2 proteins or the mutant S1 variant S1D614G. Mean fluorescence intensity (MFI) of (C) CD181 expression and (D) CX3CR1 expression by total monocytes from pregnant (red symbols) and non-pregnant (blue symbols) women in response to SARS-CoV-2 proteins (circles) or control (triangles). *p < 0.05; **p < 0.01. (+) Stimulated, (−) Control.
