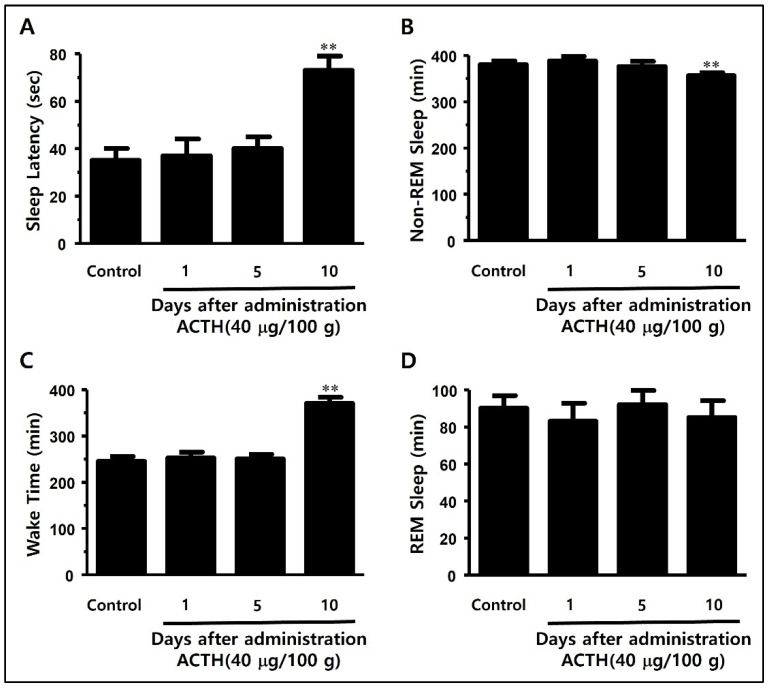
Figure 8.
Changes in (A) waking time, (B) sleep latency, (C) non-REM sleep time, and (D) REM sleep time according to the days after ACTH injection in SD rat models. (A) Analysis of the change in waking time after 1, 5, and 10 days of ACTH injection shows a significant increase in waking time on day 10 compared to the control group. (B) Analysis of the change in sleep latency shows a significant increase in sleep latency on day 10 compared to the control group. (C) Analysis of the change in total non-REM sleep time shows a significant decrease in non-REM sleep time at day 10 compared to the control group. (D) The change in total REM sleep time shows no statistical significance. ACTH (400 μg/kg) was intraperitoneally injected on days 1, 5, and 10. The data are shown as mean ± standard deviation. Each group consists of three mice. Statistical significance was evaluated based on the p-value, and significant differences from the control group are marked as ** p < 0.001.

