Figure 5.
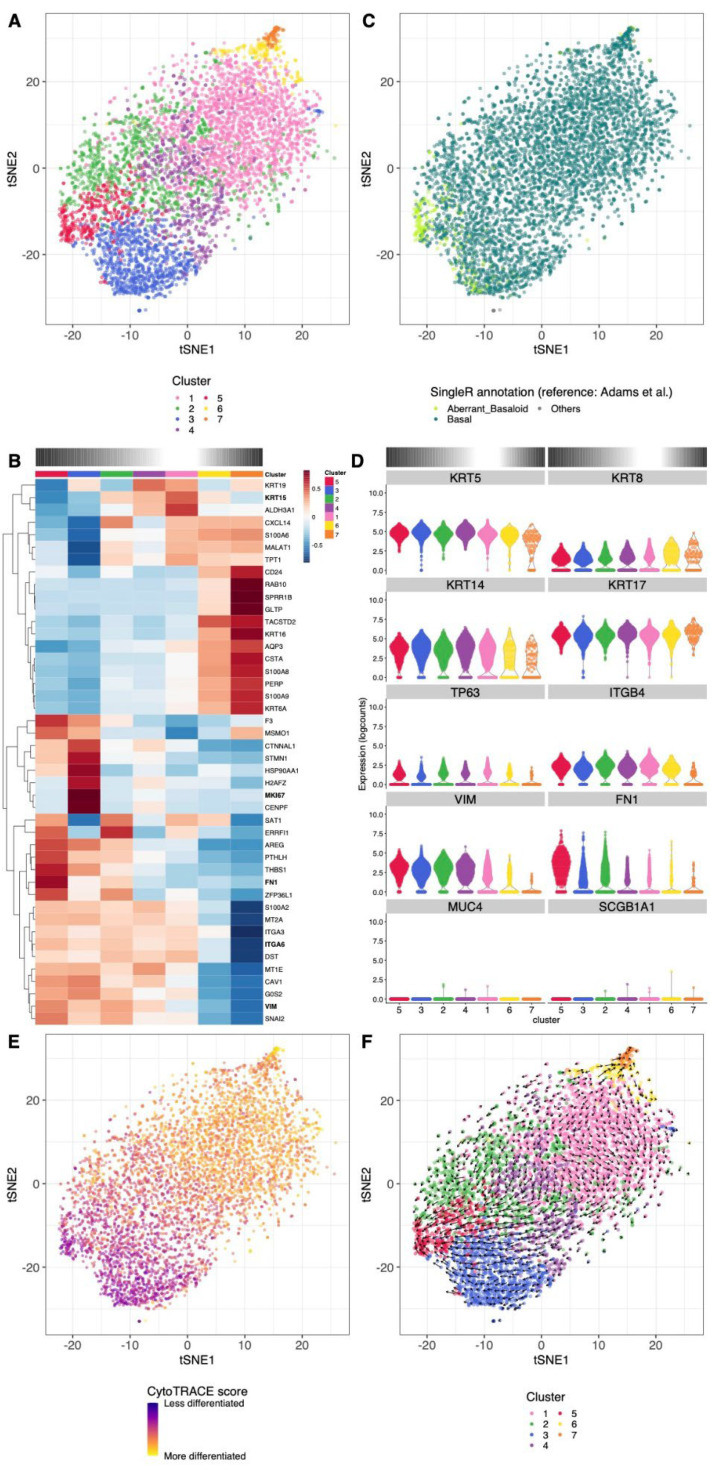
Clustering and cell type annotation of alveolar basal cells cultured in Cnt-PR-A. (A) tSNE showing the separation of the cells into seven clusters. (B) t-SNE showing the best matching cell type for each cell, similar to Figure 2B. (C) Relative expression across clusters of the strongest cluster-specific genes in the dataset. Clusters are ordered to reflect the presumed differentiation gradients described in the text, indicated with a gradient color bar on top of the heatmap. (D) Violin plot showing the log-normalized expression of basal cell marker KRT5, KRT17, KRT14, TP63, ITGB4, mesenchymal marker FN1 or VIM, secretory epithelial cell marker MUC4 or SCGB1A1 or transitional epithelial cell marker KRT8 across clusters. Clusters are ordered to reflect the presumed differentiation gradients described in the text, indicated with a gradient color bar on top of the panel. (E) tSNE showing the CytoTRACE differentiation state scores across cells. (F) tSNE overlaid with the embedded velocity vectors of the RNA velocity analysis, similar to Figure 3F.

