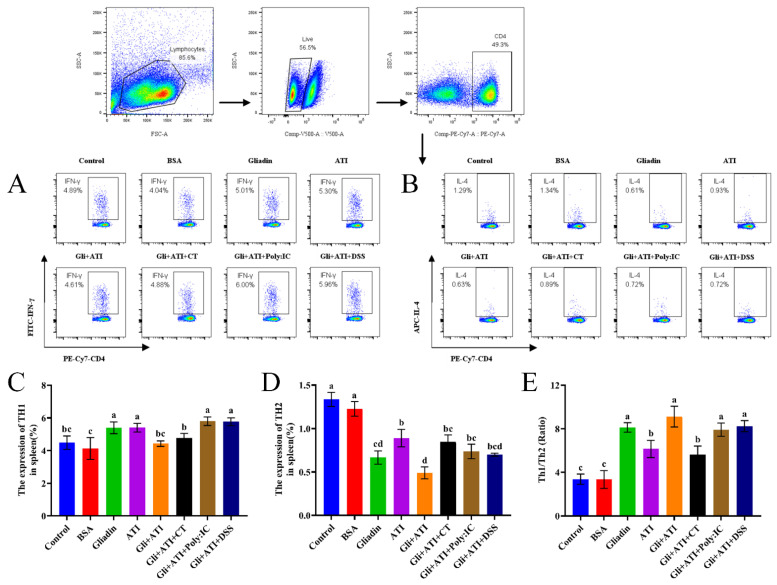
Figure 5.
The homeostasis of differentiation of Th1 and Th2 subpopulations in splenocytes of mouse using flow cytometry. (A,B) T-helper type 1 (Th1) and T-helper type 2 (Th2) cell subpopulations. (C,D) The expression percentage of Th1 and Th2 subpopulations. (E) The ratios of Th1/Th2 cells. Different letters represent significant differences (p < 0.05) between groups.

