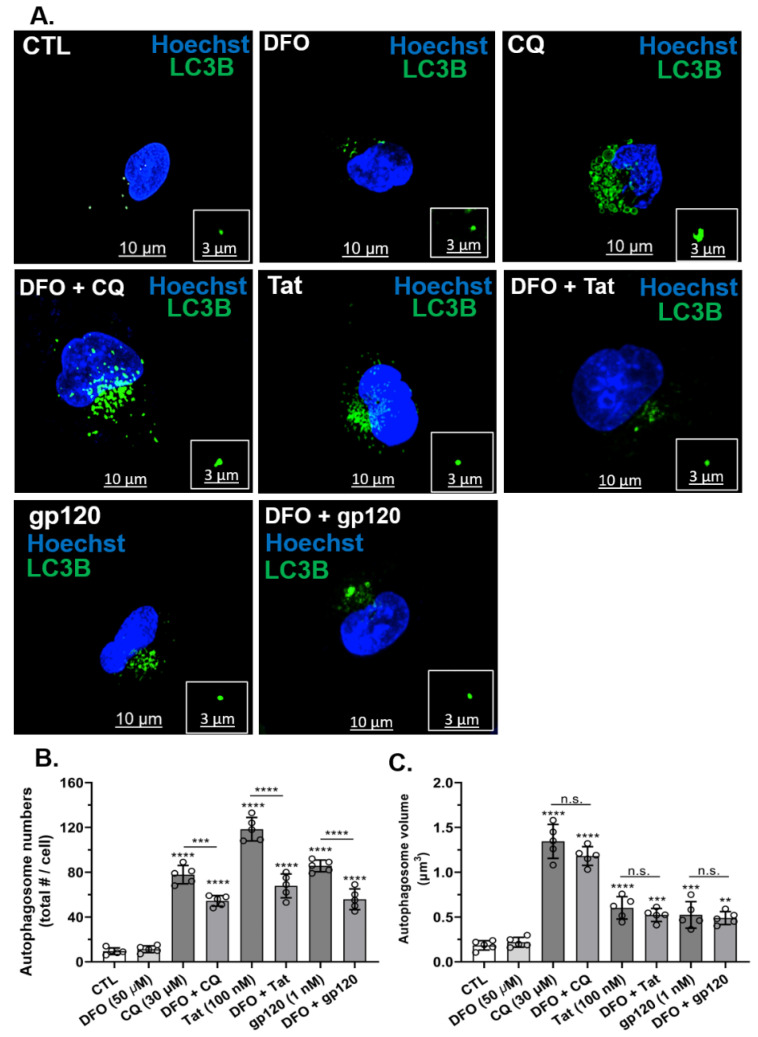
Figure 3.
DFO blocked HIV-1 Tat-, gp120- and CQ-induced increases in autophagosome numbers but not volumes. (A) Representative fluorescence microcopy images of autophagosomes (LC3B, green) and nuclei (blue). Qualitatively, DFO blocked CQ-, HIV-1 Tat- and gp120-induced changes in autophagosome numbers and volume. (B,C) Quantitatively, CQ (30 µM), Tat (100 nM), and gp120 (1 nM) increased autophagosome numbers and volume, and DFO significantly (p < 0.0001) decreased autophagosome formation but did not reduce changes in autophagosome volumes. Image analysis and quantification were performed from five independent experiments with 30 cells quantified for each experimental condition (n = 150). Error bars represent standard deviation (SD) of five independent experiments. A one-way ANOVA multiple comparisons test was used to compare data from control and treatment groups. Cells were chosen randomly during image acquisition and analysis from the microscope field of view, and no cells were intentionally excluded. Scale bars are 10 µm for the image and 3 µm for the inset. ** p < 0.01, *** p < 0.001, and **** p < 0.0001; n.s.: non-significant.

