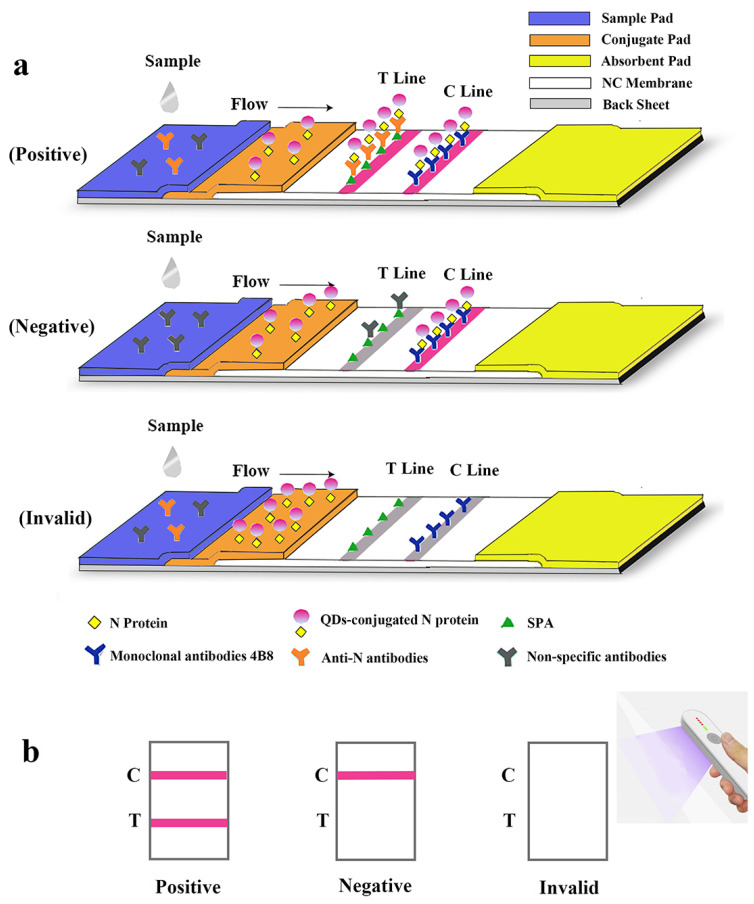
Figure 3.
Schematic illustration of the lateral flow assay for the rapid detection of antibodies against SARS-CoV-2 N protein. (a) Schematic diagram of the detection device. (b) Interpretation of different testing results under UV light. “C” and “T” refer to the control line and the test line, respectively.

