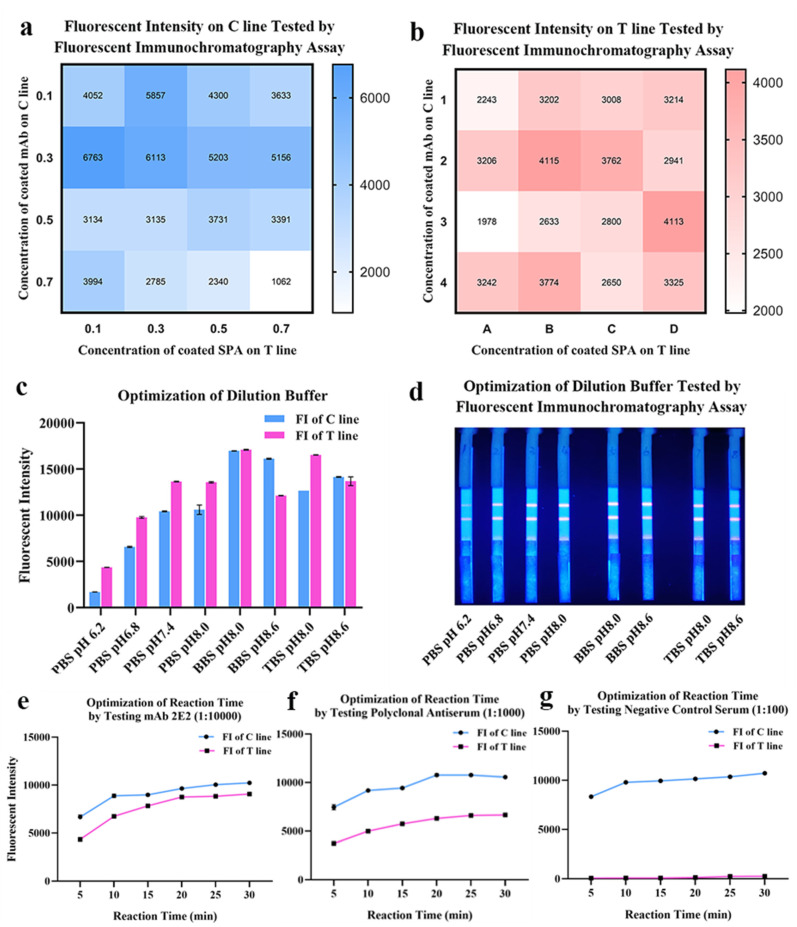
Figure 4.
Optimization of coating concentrations, pH and buffer solution of the lateral flow assay. (a,b) Optimization of coated mAbs and SPA on the T line and the C line. The fluorescent intensity data was presented by heat map. (c,d) Optimization of the dilution buffer and pH. (e–g) Optimization of reaction time by testing mAbs, antiserum and negative control.

