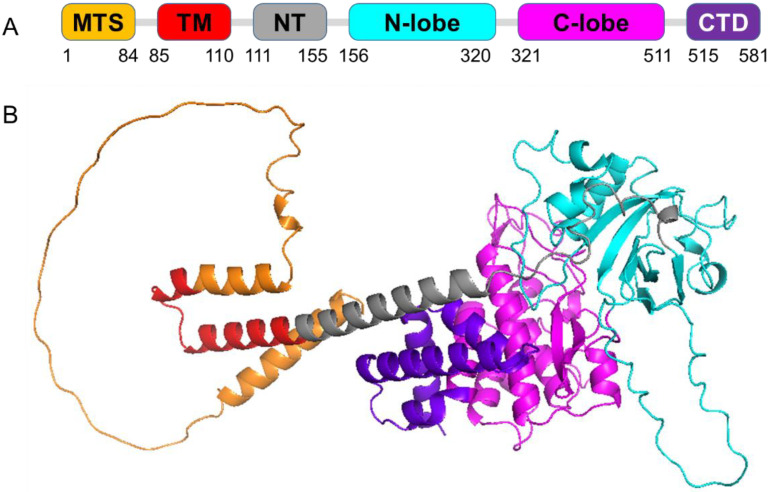
Figure 2.
Three-dimensional (3D) predicted model of full-length human Pink1 (581 amino acid residues) (AlphaFold predicted model: Q9BXM7). Pink1 domain structure (A) and cartoon representation (B) are shown in colors that correspond to the respective domain colors. The domains are colored as follows: mitochondrial targeting sequence (MTS, orange), transmembrane region (TM, red), N-terminal regulatory region (NT, gray), N-lobe of the kinase domain (cyan), C-lobe of the kinase domain (magenta) and the C-terminal domain (CTD, purple). PyMol (Schrodinger LLC) was used to generate the figure [24].

