Figure 2.
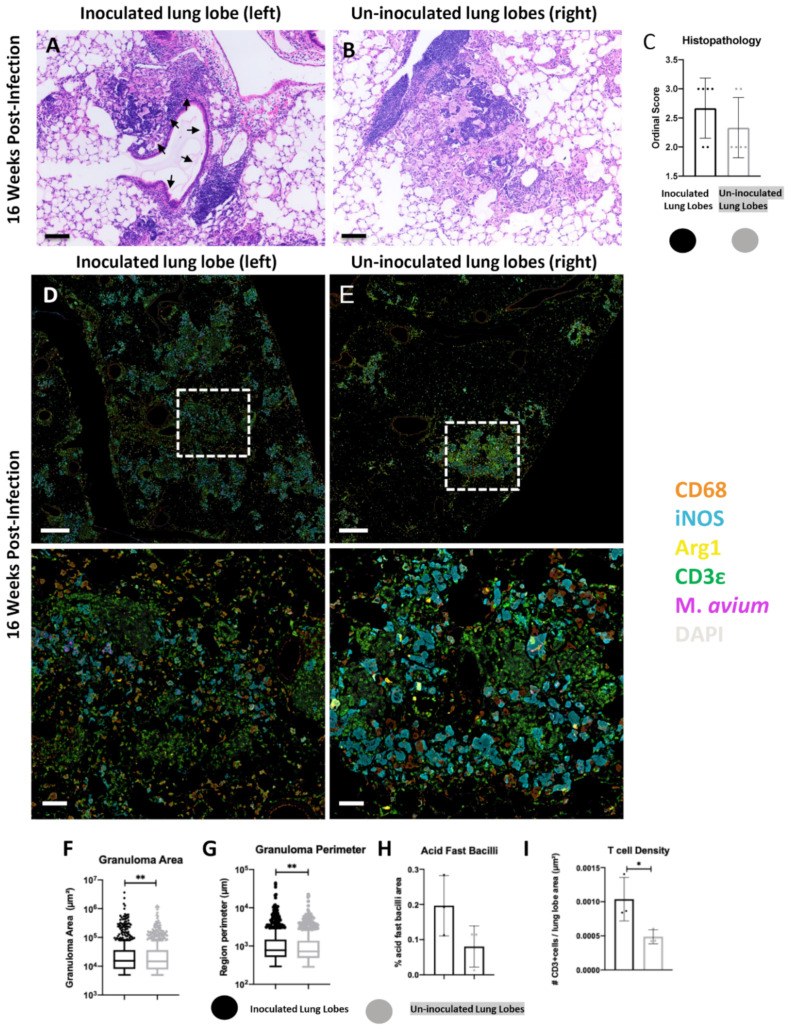
Comparison of inoculated (left) and un-inoculated lung lobe (right) lesions at 16 weeks-post infection (wpi) following unilateral left mainstream intrabronchial M. avium inoculation in B6.Sst1S mice. (A) representative micrograph of primary lesions in the inoculated left lung lobe with granulomatous infiltrate in immediate proximity to a bronchiole (black arrows); (B) representative micrograph of secondary lesions in an un-inoculated right lung lobe composed predominantly of granulomatous infiltrate with intralesional lymphoid aggregates. (A,B) assessed by hematoxylin and eosin (H&E) and visualized using brightfield microscopy; (C) ordinal histopathology scores, inoculated vs. un-inoculated lung lobes; (D,E) representative raw fluorescent multiplex immunohistochemistry (fmIHC)images of inoculated (left-D) and un-inoculated (right-E) lung lobes. Lesions in the left inoculated lobe coalesced and extended outwards from airways, while lesions in uninoculated lung lobes were randomly distributed in the interstitium. The lower row in (D,E) represents higher magnification images of the white hashed boxes outlined in the top row; (F) granuloma lesion area calculated using random forest tissue classification; (G) granuloma lesion perimeter calculated using random forest tissue classification; (H) Acid Fast Bacilli staining area quantification (AQ), and (I) T cell density. For (C), each data point represents a single tissue section, n = 6. For (F,G), each data point represents a single lesion; n = 662 (inoculated lobes), n = 913 (uninoculated lobes); lesion area and perimeter were calculated using random forest tissue classification. For (H,I), each data point represents a single animal; n = 3 (inoculated lobes), n = 3 (uninoculated lobes). Data are expressed as means ± SD or with Tukey whiskers. Asterisks denote p-values with a Mann–Whitney test (*) or Student’s unpaired t-test (*-*). * p < 0.05, ** p < 0.005. Original magnification, 100× (A,B, D,E, bottom row) and 20× (D,E, top row)100×. Scale bars; 100 μm (A,B,D,E, bottom row); 500 μm (D,E, top row).

