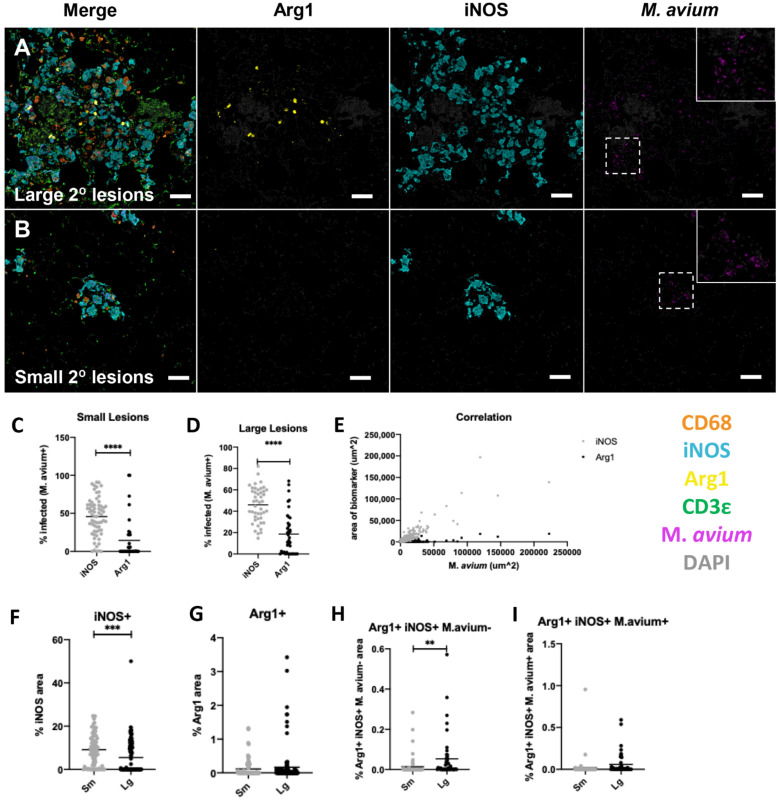
Figure 4.
Characterization of macrophage populations in large and small secondary lesions at 16 weeks post-infection (wpi) following unilateral left mainstream intrabronchial M. avium inoculation in B6.Sst1S mice. (A,B) representative raw fluorescent multiplex immunohistochemical (fmIHC) image of large secondary lesions (A-top row), and small secondary lesion (B-lower row), with all filters turned on, or only Arg1, iNOS, or M. avium individually (C) percentage antigen overlay of M. avium+ area with iNOS+ and Arg1+ in small lesions; (D) percentage antigen overlay of M. avium+ area with iNOS+ and Arg1+ in large lesions; (E) correlation between M. avium area on x-axis and iNOS or Arg1 area on y-axis; (F–I) AQ of iNOS, Arg1, and M. avium overlay in small and large granulomatous lesions; (F) iNOS AQ; (G) Arg1 AQ; (H) Arg1+/iNOS+/M. avium− AQ; (I) Arg1+/iNOS+/M. avium+ AQ. For (C–I), each data point represents a single lesion. For (C), n = 66 (iNOS), n = 36 (Arg1); for (D), n = 45 (iNOS), n = 40 (Arg1); for (E), n = 883; for (F–I), n = 67 (large lesions), n = 45 (small lesions). Data are expressed on scatter dot plots with medians. Asterisks denote p-values with Student’s unpaired t-test. ** p < 0.005, *** p < 0.0005, and **** p < 0.00005. Original magnification 100 × 200 × 100 × (A,B). Scale bars: 50 μm (A,B).

