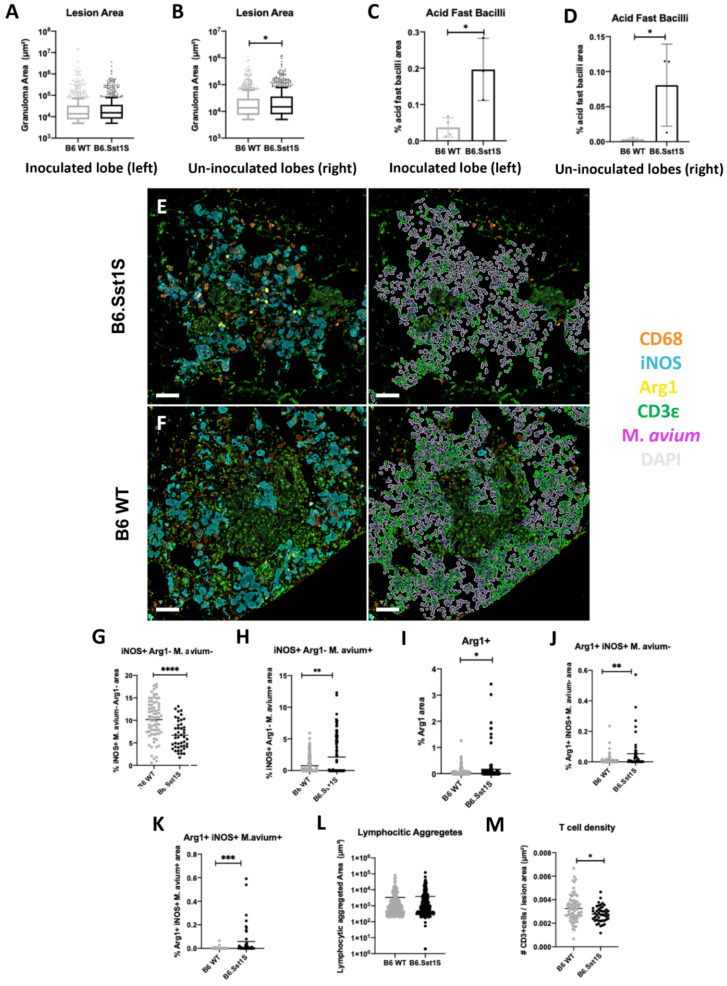
Figure 6.
Comparison of immunopathology in inoculated (left) and un-inoculated lung lobes (right) from M. avium inoculated B6 WT compared to B6.Sst1S at 16 weeks-post infection (wpi) and the impact of sst1-S in large secondary lesions at 16 wpi. (A–D) inoculated vs. un-inoculated lobes; (A) Inoculated lobe lesion area; (B) un-inoculated lobe lesion area; (C) inoculated lobe Acid Fast Bacilli (AFB) area quantification (AQ); (D) un-inoculated lobe AFB AQ; (E,F) representative raw fluorescent multiplex immunohistochemistry (fmIHC) image of B6.Sst1S (upper left-E) and B6 WT (lower left-F) large secondary lesions. Right images in (E,F) are high-plex phenotyping overlays with CD3ε cells in green. Note DAPI aggregates were excluded from analysis; (G–K) iNOS, Arg1, and M. avium AQ immunoreactivity in B6 WT vs. B6Sst1S large secondary lesions; (G) iNOS+/Arg1−/M. avium− AQ; (H) iNOS+/Arg1−/M. avium+ AQ; (I) Arg1+ AQ; (J) Arg1+/iNOS+/M. avium− AQ; (K) Arg1+/iNOS+/M. avium+ AQ; (L) Area of lymphocytic aggregates found in large secondary lesions of B6 WT and B6.Sst1S secondary lesions. Random forest TC was used to classify areas of lymphocytic aggregates (high density DAPI and CD3ε+ staining) within large secondary lesions; (M) T cell lesion density in B6 WT and B6.Sst1S large secondary lesions excluding lymphocytic aggregates. For (C,D), each data point represents a single animal; n = 4 (B6 WT), n=3 (B6.Sst1S). For (A,B,F–J,L,M), each data point represents a single lesion. For A, n = 754 (B6 WT), n = 662 (B6.Sst1S); For (C), n = 984 (B6 WT), n = 913 (B6.Sst1S); for (F–J), n = 141 (B6 WT), n = 117 (B6.Sst1S); for (L), n = 225 (B6 WT), n = 247 (B6.Sst1S); For M, n = 78 (B6 WT), n = 48 (B6.Sst1S). Data are expressed on scatter dot plots with medians. Asterisks denote p values with Student’s unpaired t-test. * p < 0.05, ** p < 0.005, *** p < 0.0005, and **** p < 0.00005. Original magnification 100× (E,F). Scale bars: 50 μm (E,F).

