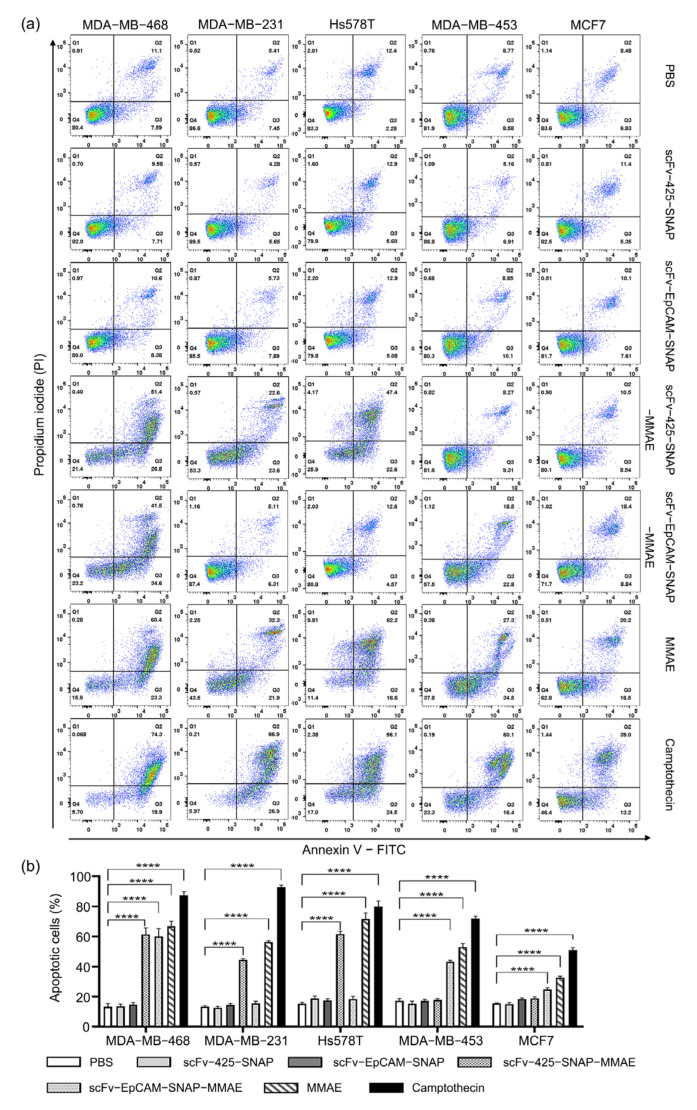
Figure 4.
Induction of apoptosis by MMAE, scFv-SNAP fusion proteins and corresponding ADCs. (a) Scatter plot of one measurement as an example. (b) The sum of early and late apoptotic cells from three independent experiments carried out in triplicate. Data are shown as mean ± SEM. The statistical analysis was carried out using one-way ANOVA and corrected by Tukey’s test (**** p ≤ 0.001).

