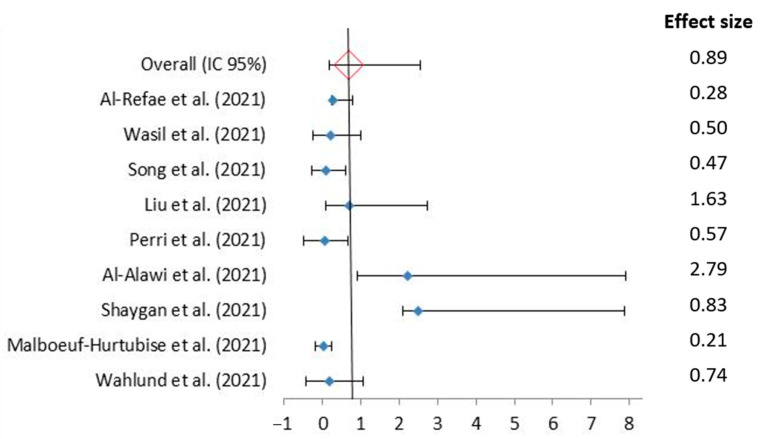
Figure 3.
Forest plot of the psychological intervention effect during the SARS-CoV-2 pandemic Using Random Effects Model [20,21,22,23,24,25,26,27,28]. Squares indicate the OR of individual studies, and the extended lines denote 95% confidence intervals (CI). The diamond data indicates pooled prevalence. Test of heterogeneity: I2 = 99.99%, p = 0.00.

