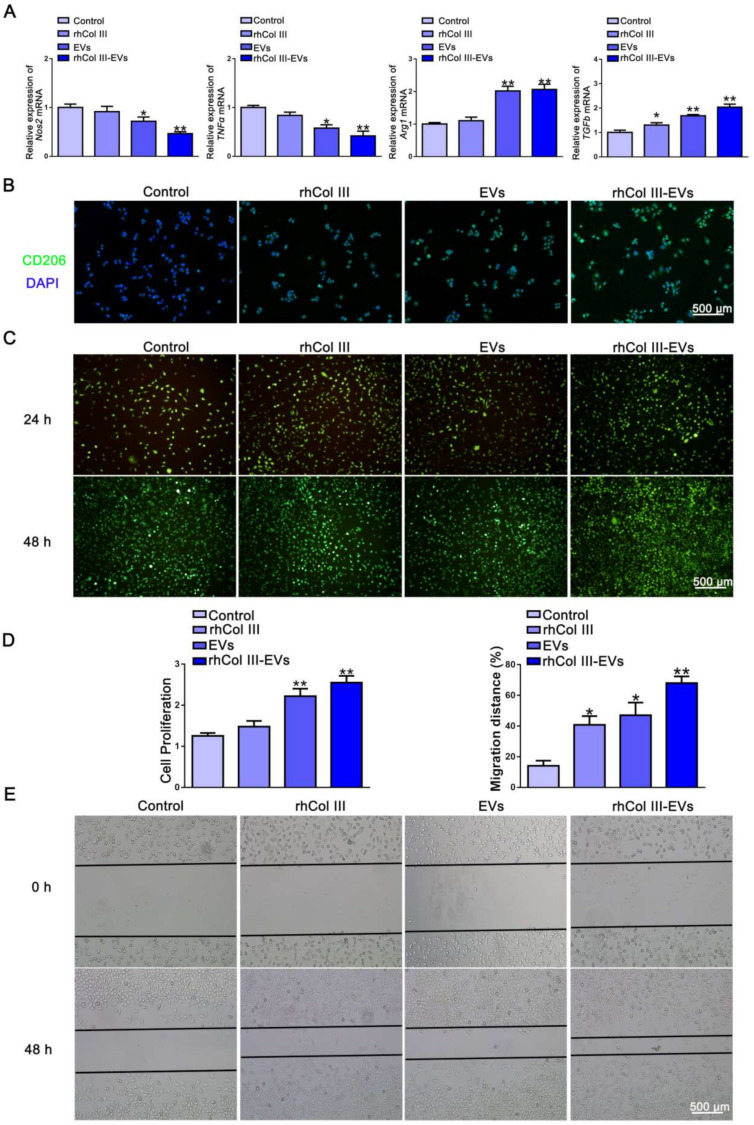
Figure 3.
The differentiation of RAW264.7 cells and the migration of L929 cells. (A) QRT-PCR to detect the expression of M1 and M2 molecular markers in RAW264.7 cells. (B) Immunofluorescence (green) showing the number of CD206-positive cells in RAW264.7 cells (n = 3). (C) Live/dead analysis of L929 cells in different groups (n = 3). (D) Proliferation of L929 cells in different groups (n = 3, * p-value < 0.05 vs. Control group, ** p-value < 0.01 vs. Control group). (E) Scratch test detected the migration ability of L929 cells (n = 3, * p-value < 0.05 vs. Control group, ** p-value < 0.01 vs. Control group).

