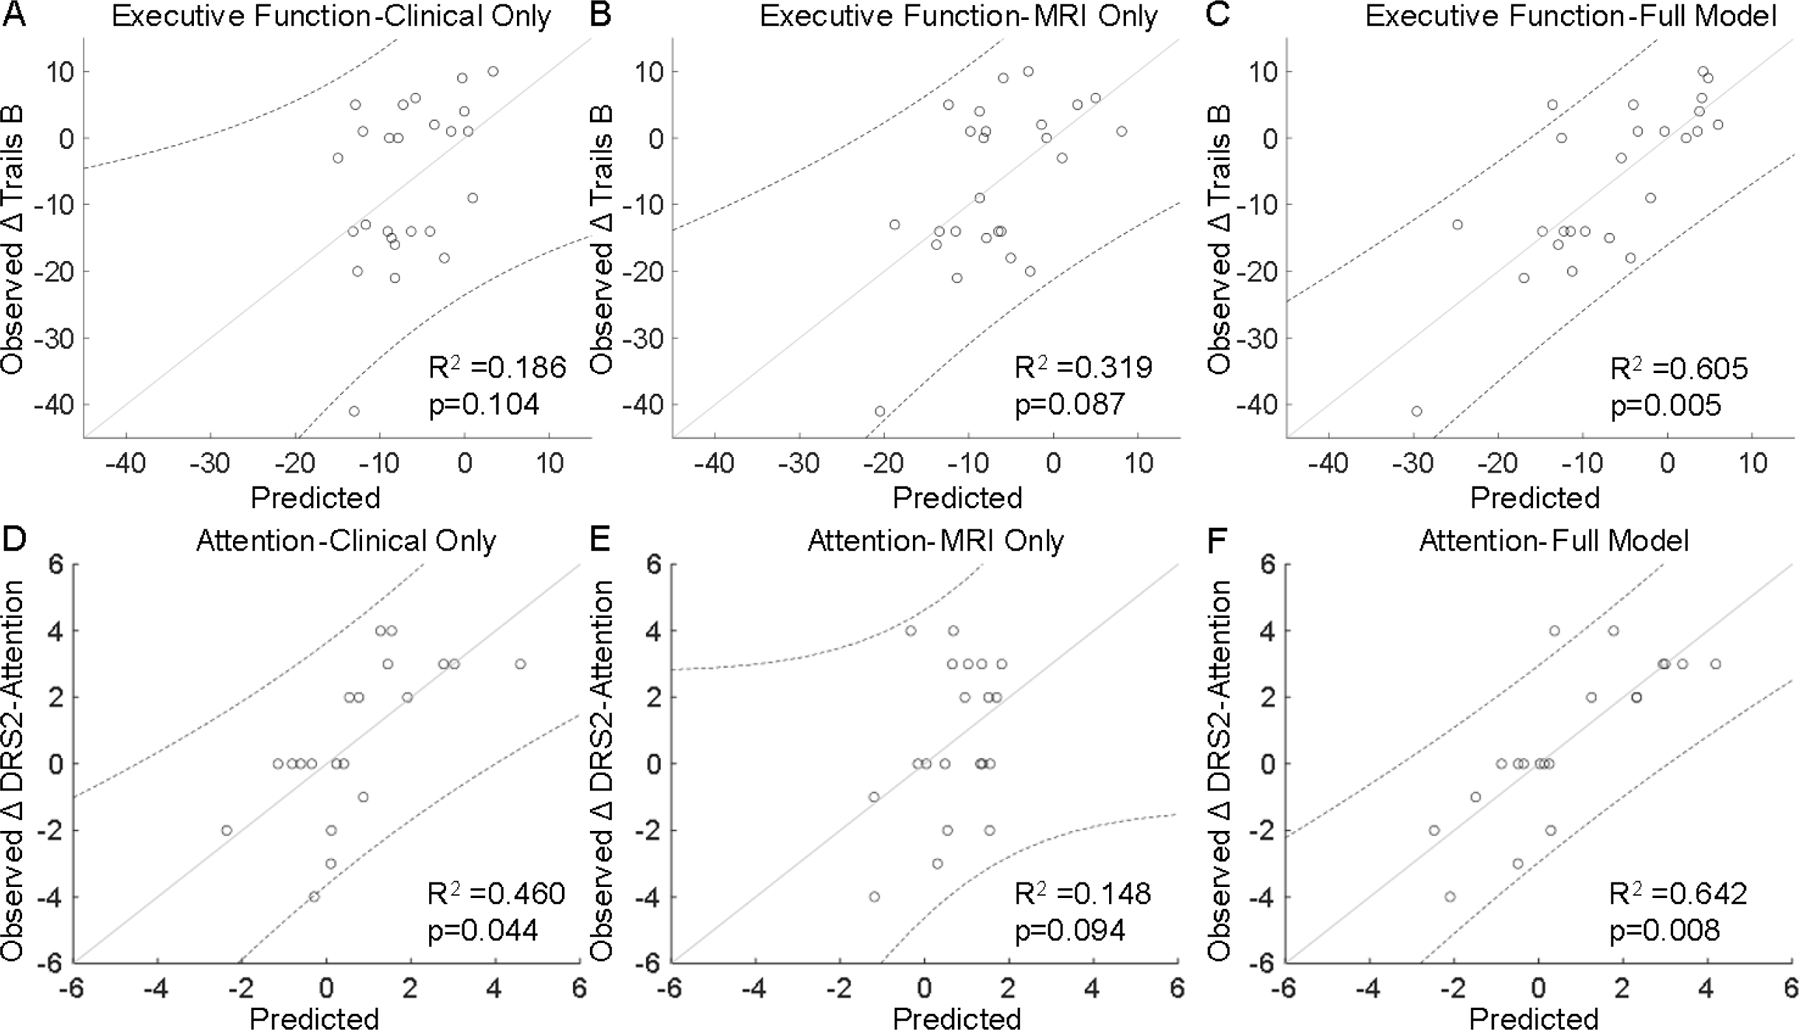
Fig 3. Model prediction of executive function and attention outcomes.

Prediction of executive function outcomes (Δ Trails B) using A) clinical-only data [age, disease duration], B) MRI-only metrics [R2* in caudate, subthalamic nucleus, hippocampus], and C) the combined model (clinical and MRI data). Prediction of attention outcomes [Δ Dementia Rating Scale-2 (DRS2)-Attention] using D) clinical-only data [age, sex, disease duration, pre-DBS test score], E) MRI-only metrics [R2* in putamen], and F) the combined model (clinical and MRI data). R2 and p-values are from the model fit. Points represent individual data values, the solid line is the best fit line, and the dotted lines are the upper and lower bounds of the 95% confidence interval.
