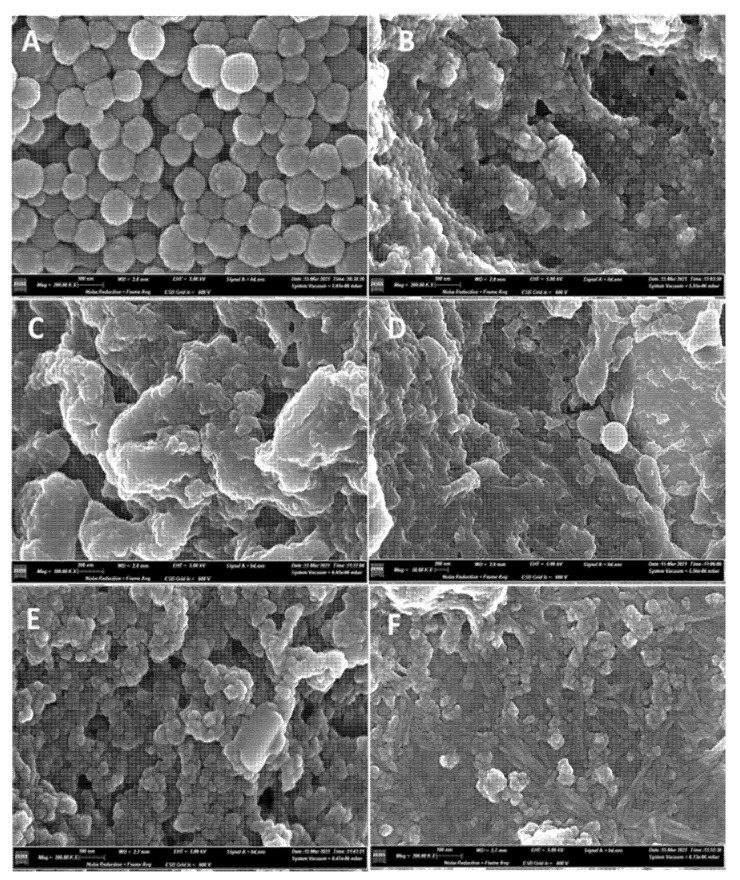
Figure 2.
FE-SEM images of sepia melanin after LMCS treatments. Panel (A): native sepia melanin. Panel (B): sepia melanin after treatment with LMCS ABTS/V. Panel (C): sepia melanin after treatment with LMCS TEMPO/V. Panel (D): sepia melanin after treatment with LMCS Syr/V. Panel (E): sepia melanin after treatment with LMCS AS/V. Panel (F): sepia melanin after treatment with LMCS Va/V.

