Figure 2.

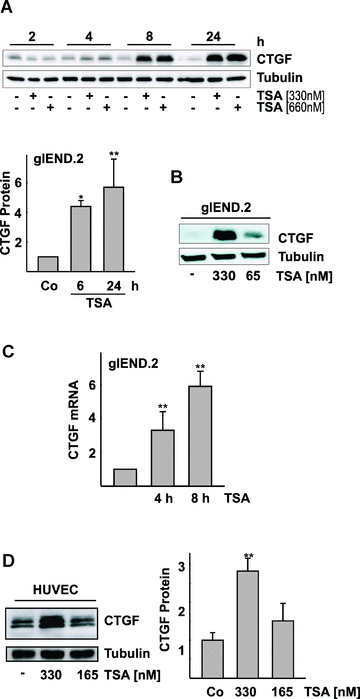
Time‐ and concentration‐dependent induction of CTGF protein and mRNA in endothelial cells by the HDAC inhibitor TSA. (A) Microvascular renal endothelial cells, glEND.2, were treated with of TSA (330 and 660 nM) for the times indicated. CTGF was detected by Western blot analysis. The graph summarizes the data of three (6 hrs) and five (24 hrs) experiments (stimulation with 330 nM TSA). Expression of CTGF in control cells was set to 1 at both time points. *P < 0.05, **P < 0.01 compared with control cells. (B) glEND.2 cells were treated with 330 and 65 nM TSA for 24 hrs. CTGF was detected by Western blotting. (C) glEND. 2 cells were stimulated with TSA (330 nM) for 4 and 8 hrs. CTGF mRNA expression was analyzed by real‐time RT‐PCR. The mRNA expression of control cells was set to 1. Data are means ± S.D. of four experiments. P < 0.05 compared with control cells. (D) HUVEC were stimulated with TSA (165 or 330 nM) overnight. CTGF was detected by Western blot analysis. The graph summarizes n= 3 experiments, **P < 0.01 compared with control‐stimulated cells.
