Figure 7.

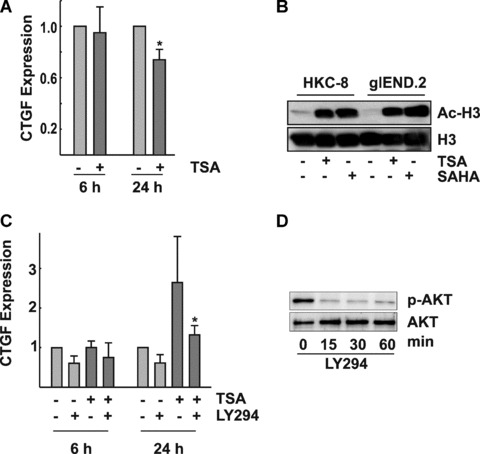
Cell density–dependent modulation of CTGF expression by TSA in epithelial cells. (A) Confluent HKC‐8 cells were incubated with TSA (330 nM) for the times indicated. CTGF expression was detected in cellular homogenates by Western blotting. The graph summarizes data of n= 4 experiments, CTGF expression in control cells was set to 1 at each time point; *P < 0.05. (B) HKC‐8 and for comparison glEND.2 cells were treated with SAHA (10 μM) or TSA (330 nM) for 6 hrs. Immunoreactive‐acetylated histone H3 (Ac‐H3) was detected in nuclear extracts. Re‐detection of total histone H3 served as loading control. (C) HKC‐8 cells were seeded at low density (20,000 cells/cm2) and were stimulated the next day with TSA (330 nM) in the presence or absence of 10 μM LY294002 for the times indicated. Expression of CTGF in control cells was set to 1 at each time point. Data are means ± S.D. of n= 3 experiments. *P < 0.05 compared with cells stimulated with TSA. (D) HKC‐8 cells were treated with 10 μM LY294002 for the times indicated. Expression of phospho‐AKT (p‐AKT) and AKT was detected by Western blotting.
