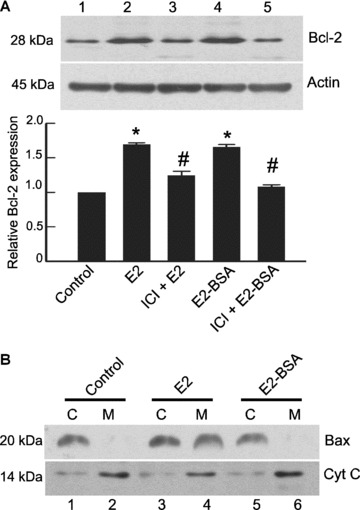
Figure 2.

Regulation of Bax and Bcl‐2 is mediated by E2 receptors localized at different sub‐cellular locations. (A) Extracts of THP‐1 cells treated with E2 (10 nM)(lane 2) and E2‐BSA for 6 hrs (10 nM)(lane 4) show Bcl‐2 up‐regulation. Presence of ICI 182,780 (1 μM) during E2 (lane 3) and E2 BSA (lane 5) treatment inhibited Bcl‐2 up‐regulation. Same blots were stripped and reprobed for actin, which was used as a loading control. The bar graph represents densitometric measurements of Bcl‐2 expression relative to control and normalized to actin (n= 3). The error bars represent ± SEM. *P < 0.05 compared with control. #P < 0.05 compared with E2 or E2‐BSA treated group. (B) THP‐1 macrophages were exposed for 6 hrs to E2 (lanes 3 and 4) or E2 BSA (lanes 5 and 6) and subcellular fractions of mitochondria (M) and cytosol (C) were analysed for the localization of Bax. Note the absence of Bax translocation in the E2‐BSA treated groups. The blot was stripped and reprobed for cytochrome c to determine the homogeneity of mitochondrial fractions. Note the heavy presence of cytochrome c in the mitochondrial fraction. All data are representative of at least three independent experiments. Cyt C: cytochrome c.
