Figure 3.


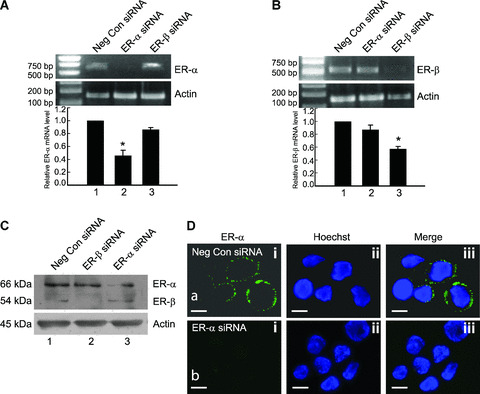
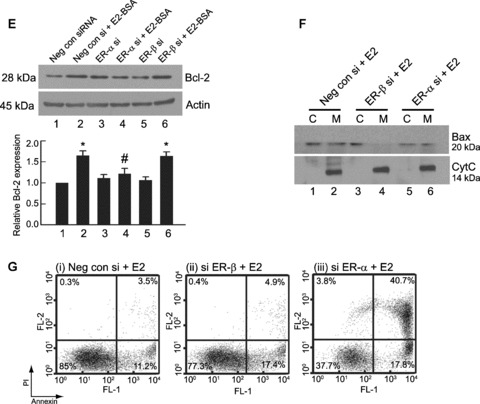
Bcl‐2 increase and Bax translocation are regulated by distinct oestrogen receptor subtypes. (A) RT‐PCR for ER‐α mRNA. Down‐regulation of ER‐α mRNA at 24 hrs of treatment by siRNA against ER‐α (lane 2) in THP‐1 cells as visible by amplification of mRNA for ER‐α by RT‐PCR. Note that there is no down‐regulation of ER‐α mRNA in cells transfected with ER‐β siRNA (lane 3). (B) RT‐PCR for ER‐β mRNA. Down‐regulation of ER‐β mRNA by siRNA against ER‐β (lane 3) at 24 hrs of treatment as visible by amplification of mRNA for ER‐β by RT‐PCR. Note that there is no down‐regulation of ER‐β mRNA (lane 2) in cells transfected with ER‐α siRNA. (C) Western blot analysis on whole cell lysates for expression of ER‐α and ER‐β in THP‐1 cells transfected with negative control siRNA (lane 1), ER‐β siRNA (lane 2) or ER‐α siRNA (lane 3), 24 hrs after transfection. Note the down‐regulation of ER‐α and ER‐β after treatment with respective siRNAs. The blot was stripped and reprobed for actin, which was used as an endogenous loading control. (D) Live cell fluorescence microscopic analysis of ER‐α expression on the plasma membrane by immunostaining with an ER‐α specific antibody in negative control siRNA transfected (a, i–iii) and ER‐α siRNA (b, i‐iii) transfected THP‐1 macrophages at 24 hrs. The blue stain (ii) is labelling with the nuclear dye Hoechst 33342. Note the loss of membrane ER‐α expression in ER‐α siRNA transfected cells (b, i‐iii). The bar represents 10 μm. (E) Analysis of Bcl‐2 expression by Western blotting in THP‐1 macrophages transfected with negative control siRNA (Neg con siRNA), ER‐α siRNA (ER‐α si) or ER‐β siRNA (ER‐β si) for 24 hrs and subsequently treated with or without 10 nM E2‐BSA for 6 hrs. Note the reduction in Bcl‐2 when ER‐α siRNA and E2‐BSA (lane 4) was used compared with ER‐β siRNA and E2‐BSA, respectively (lane 6). Western blot for actin was used as loading control. Bar graph is densitometric representation of the relative Bcl‐2 expression compared with negative control siRNA transfected cells. *P < 0.05 compared with the respective control groups. #P < 0.05 compared with negative control siRNA transfected cells treated with E2‐BSA. (F) Western blot analysis for subcellular localization of Bax was performed in cells transfected with negative control siRNA (lanes 1, 2), ER‐β siRNA (lanes 3, 4) or ER‐α siRNA (lanes 5, 6) for 24 hrs, followed by treatment with 10 nM E2 for 6 hrs. Note the decrease in Bax translocation in lanes 3 and 4. The blots were stripped and reprobed for cytochrome c, which served as a control to determine the homogeneity of the obtained mitochondrial and cytosolic fractions. All data are representative of at least three independent experiments. (G) Flow‐cytometric analysis of Annexin‐V‐PI staining in ER‐α (iii) or ER‐β (ii) knockdown cells, treated with respective siRNAs for 24 hrs, followed by exposure to 10 nM E2 for 6 hrs. Note that ER‐α down‐regulation in the presence of E2 shows high number of apoptotic cells. Cells in the lower left quadrant represent viable cells. Neg Con si: negative control siRNA; siER‐α: ER‐α siRNA; si ER‐β: ER‐β siRNA.
