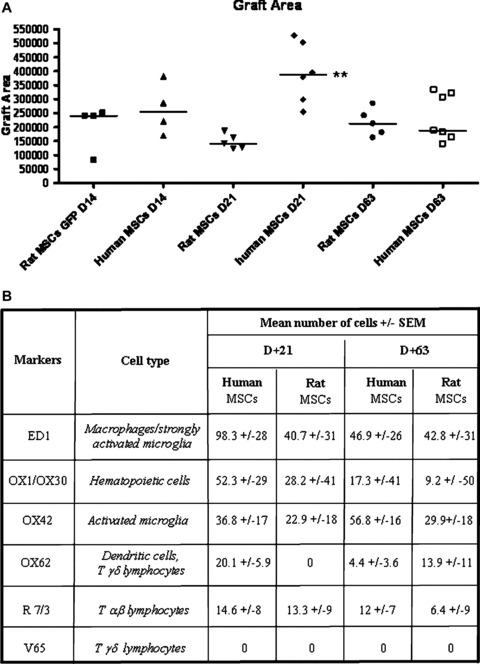
Figure 5.

A) Graft areas (in μm2) were quantified for human‐ or rat‐ MSC‐Tp at post‐transplant days 14‐, 21‐ and 63. Tp size remains stable from14 to 63 days. The straight line represents the median, the other dots, individual values. Human MSC‐Tp are significantly larger than rat‐MSC‐Tp at day 21 (**, Dunn’s test, P < 0.01). B) Quantification of the immune cells types in the implantation site at 21‐ (D+21) and 63‐ (D+63) days post‐transplantation. No significant differences were observed between human‐ and rat‐MSC‐Tp conditions suggesting a similar host inflammatory pattern for these 2 types of MSCs within host parenchyma.
