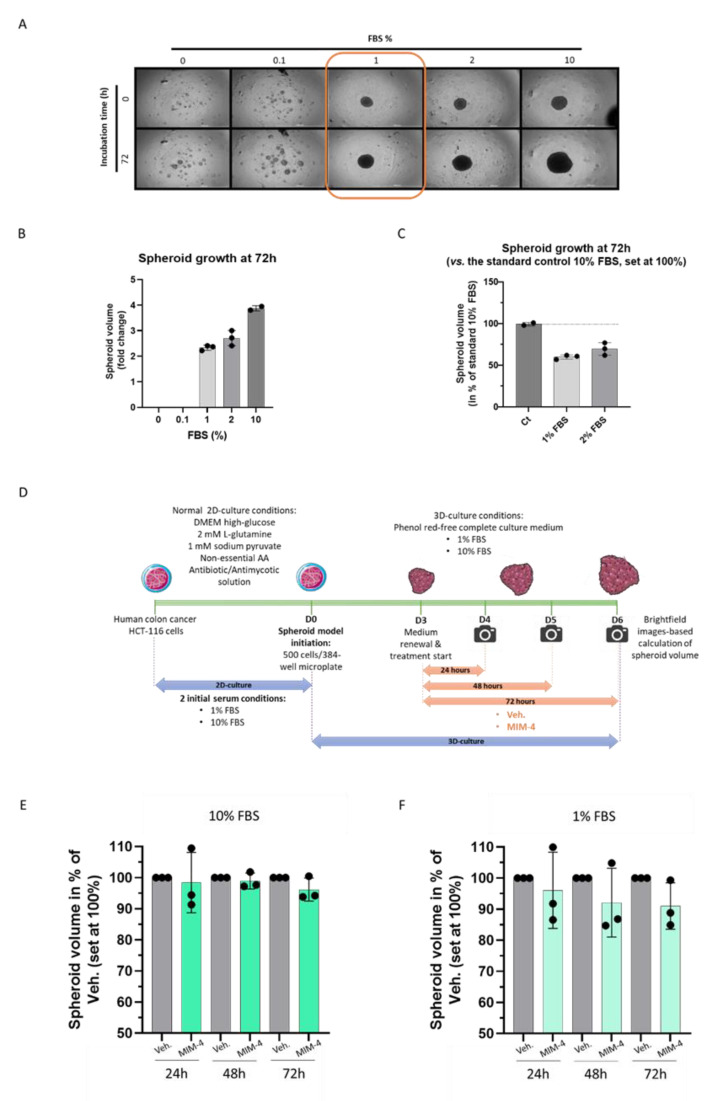
Figure 3.
MIM-4 displays slight anti-proliferative effects on HCT-116 colon carcinoma cells cultivated in 3D-spheroids’ model. (A) Representative pictures of the spheroid growth regarding the different FBS percentages tested (ranging from 0 to 10% as shown in the legend) at the time of plating and after 72 h. The pictures were taken with an automated digital widefield microscope (BioTek Cytation 5). Three images in brightfield at distinct z-axis were taken with objective 4×. The orange box highlights the 1% serum concentration that is employed as a starved culture condition for the experiment illustrated and presented in (D,E). (B) HCT-116-derived spheroid growth after 72 h of incubation in the presence of various FBS% (ranging from 0 to 10% as shown in the graph legend). (C) The results are presented as the mean ± SD of spheroid volumes folds at 72 h normalized to the same spheroid volumes at D0, in each tested-condition. Each condition was performed in 3 technical replicates (black dots). (D) Scheme of the experimental protocol (E,F) Effect of MIM-4 on HCT-116-derived spheroid growth, either in 10% or in 1% FBS. The spheroid volume was calculated for each treatment-condition (MIM-4 or Veh.) and at either 24-, 48- or 72-h and expressed as a fold change of each endpoint-measure normalized to the initial spheroid volume at D0. Results are presented as the mean percentages ± SD of the Veh. -treated spheroids for each time-point. Each condition was performed in 3 technical replicates (black dots).

