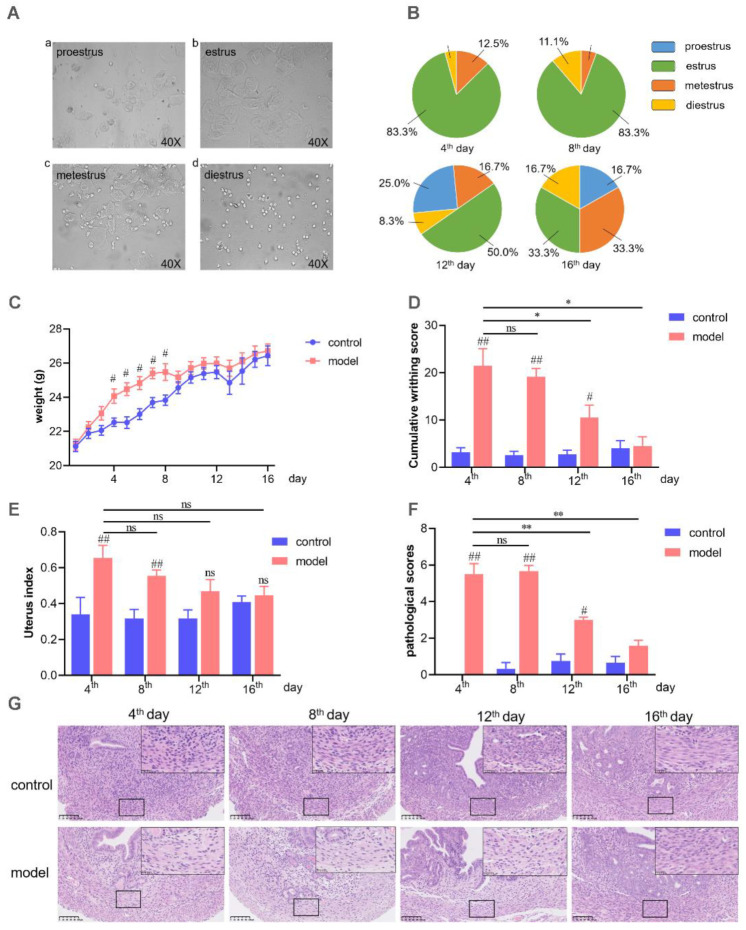
Figure 1.
The regular detection indexes relative to the PD mice model. (A) Photomicrographs of vaginal smear from mice at proestrus (a), estrus (b), metestrus (c), and diestrus (d). (B) The percentage of each estrous stage from model group on 4th, 8th, 12th, and 16th days. (C) Body weight changes of the mice. (D) Oxytocin-induced writhing response score during the experiment. (E) Uterus index of control group and model group on 4th, 8th, 12th, and 16th days. (F) Pathological scores of uterus H&E staining. (G) Example pathological section of the uterus with H&E staining (20×). # Model group compared with corresponding control group. # p < 0.05; ## p < 0.01. * p < 0.05; ** p < 0.01. ns, no significance. (n = 6 per group). The statistical values are presented in Table S1.

