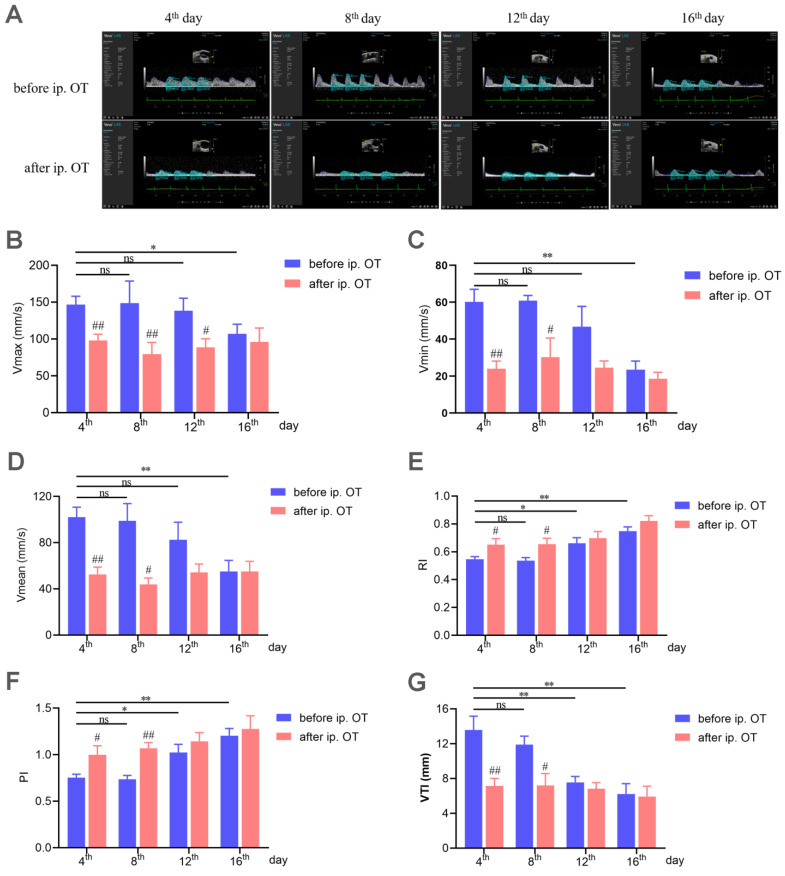
Figure 2.
PD-related uterine artery blood flow features. (A) Typical images of uterine artery Doppler waveforms from model mice before and after oxytocin injection. (B) The maximum flow velocity (Vmax) of the uterine artery. (C) The minimum flow velocity (Vmin) of the uterine artery. (D) The average flow velocity (Vmean) of the uterine artery. (E) Resistive index (RI) of uterine artery blood flow. (F) Pulsatility index (PI) of the uterine artery. (G) Velocity time integral (VTI) of uterine artery blood flow. # Model group after oxytocin injection compared with the corresponding model group before oxytocin injection. # p < 0.05; ## p < 0.01. * p < 0.05; ** p < 0.01. ns, no significance. (n = 6 per group).

