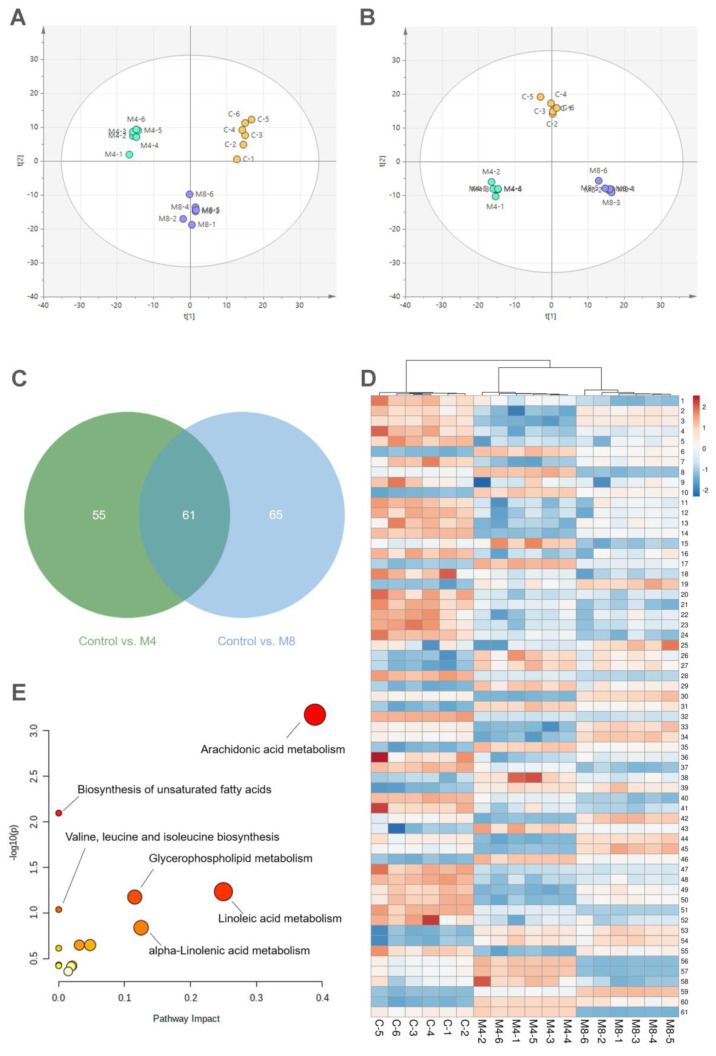
Figure 4.
Serum metabolomics analysis of recurrent PD mouse model. (A) Principal component analysis (PCA) in positive mode. (B) PCA in negative mode. (C) Venn diagram of important metabolites relative to PD recurrence shared between control group vs. M4 group and control group vs. M8 group. (D) Heat map of important metabolites significantly changed in M4 group and M8 group compared to the control group. (E) Pathway analysis of important metabolites. n = 6 per group.

