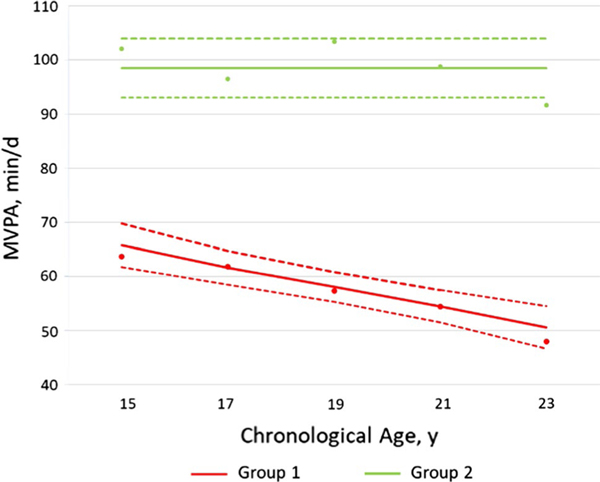
Fig. 1.
Moderate-to-vigorous intensity physical activity (MVPA) trajectory groups (Both sexes combined). Dots indicate actual mean MVPA minutes, solid lines indicate estimated MVPA minutes, and dotted lines indicate 95% confidence intervals of estimated MVPA minutes. Group 1, ‘moderately-active with decreasing MVPA’; Group 2, ‘consistently-active with high MVPA’

