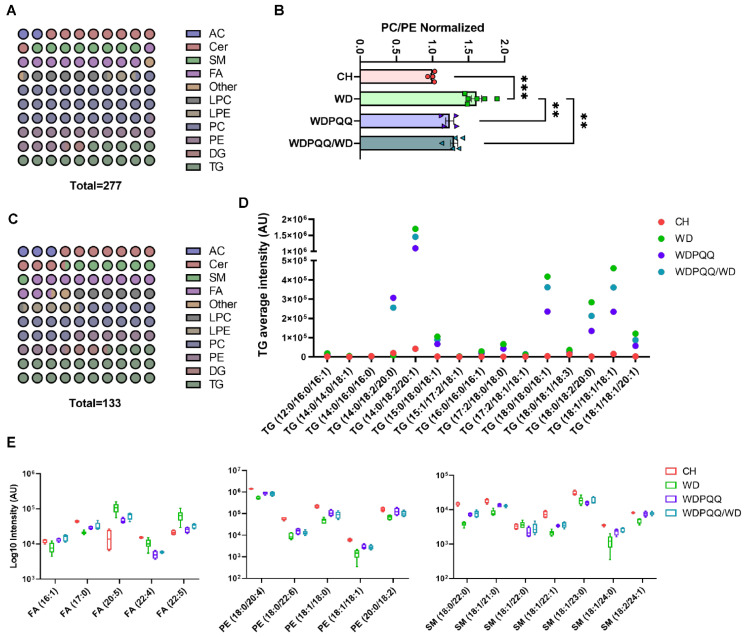
Figure 4.
Exposure to PQQ alters the compositional distribution of lipids in adult liver. (A) Dot plot of the fractional distribution of total hepatic lipids in adult liver. (B) Ratio of phosphatidylcholines (PC) to phosphatidylethanolamine (PE). Data are means ± SEM. ** p < 0.01, *** p < 0.001. (C) Dot plot of the fractional distribution of significantly changed hepatic lipids in adult liver. (D) Scatter plot of average mass spectral intensities of the 15 core triglycerides. (E) Box plots of the log10 of the spectral intensity for lipid classes and chain lengths that were the most affected by PQQ (n = 4–6/group). AC, acylcarnitines; Cer, ceramides; DG, diacylglycerides; FA, fatty acids; LPC, lysophosphatidylcholine; LPE, lysophosphatidylethanolamine; PC, phosphatidylcholines; PE, phosphatidylethanolamines; SM, sphingomyelins; TG, triglycerides.

