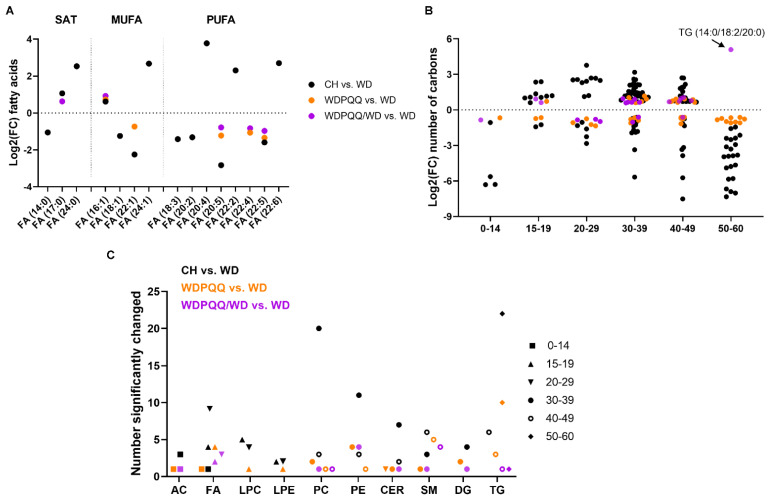
Figure 5.
Diet and PQQ alter relative enrichment of double bonds and carbons in hepatic lipids from adult mice. Scatter plots of log2 fold change (FC) as a function of (A) fatty acids and (B) number of carbons. (C) Plot of the number of lipid features that were significantly changed in each lipid species with chain length indicated. Symbol colors indicate comparison groups, i.e., black = CH vs. WD, orange = WDPQQ vs. WD, and purple = WDPQQ/WD vs. WD. AC, acylcarnitines; CER, ceramides; DG, diacylglycerides; FA, fatty acids; LPC, lysophosphatidylcholine; LPE, lysophosphatidylethanolamine; MUFA, monounsaturated; PC, phosphatidylcholines; PE, phosphatidylethanolamines; PUFA, polyunsaturated fatty acids; SAT, saturated; SM, sphingomyelins; TG, triglycerides.

