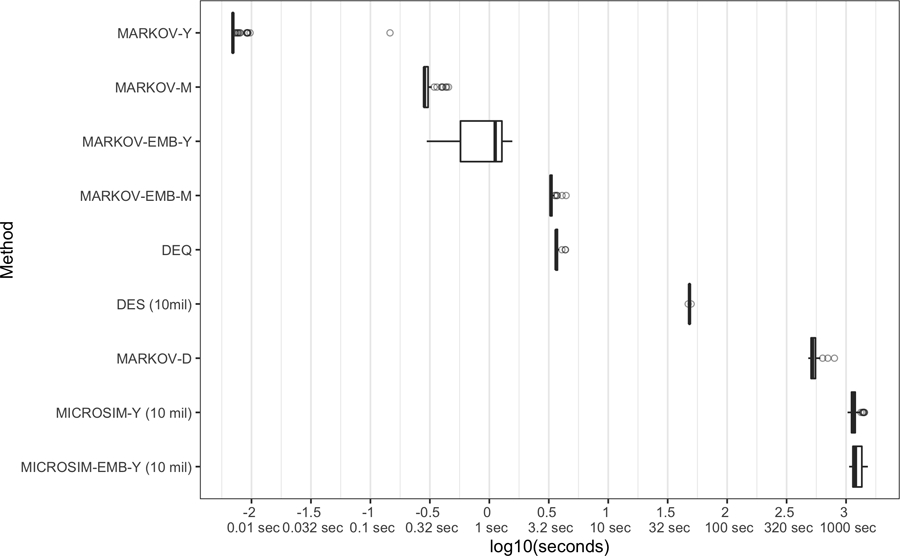
Figure 2.

Model runtime comparison. Each whisker plot shows the distribution of runtime based on 100 model runs using the same random seed (for stochastic models). For Monte Carlo-based models, number of simulated patients is provided in parentheses. DEQ, differential equations model; DES, discrete event simulation; MARKOV, discrete-time (1-year cycle) Markov model with rate-to-probability adjustment based on P(t) = 1 – e−rt”, where r is the rate and t is the time step; MARKOV-EMB, embedded discrete-time (1-year cycle) Markov model with probability matrix based on P(t) = etG, where t is the time step and G is a transition intensity matrix; MICROSIM-[D/M/Y], discrete-time (daily/monthly/yearly time cycle) microsimulation model with rate-to-probability adjustment based on P(t) = 1 – e−rt, where r is the rate and t is the time step; MICROSIM-EMB-M/Y), embedded discrete-time [monthly/yearly time cycle) microsimulation model with probability matrix based on P(t) = etG, where t is the time step and G is a transition intensity matrix; NMB, net monetary benefit (willingness to pay $100,000 per qualityadjusted life year).
