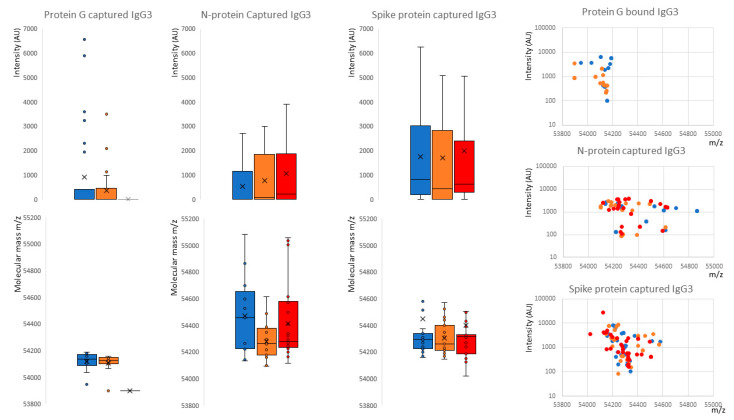
Figure 6.
Distribution of intensity for captured and eluted IgG3 heavy chains (IgG3 Hc) and the relative peak molecular masses bound and separated into sample groups. The dot plots to the right are intensity versus molecular mass for individual samples. Blue represents data from SARS-CoV-2 sero-negative HCWs, orange from SARS-CoV-2 sero-positive HCWs having recovered from mild symptoms and red sample data from convalescent patients recovering from COVID-19 ARDS. The non-parametric Kruskal-Wallis statistical test was carried out to test differences between study cohorts; the p values (alpha: 0.05) were as follows: protein G capture intensity p = 0.61, molecular weight p = 0.006; protein N capture intensity p = 0.067, molecular weight p = 0.19; protein S capture intensity p = 0.75, molecular weight p = 0.97.

