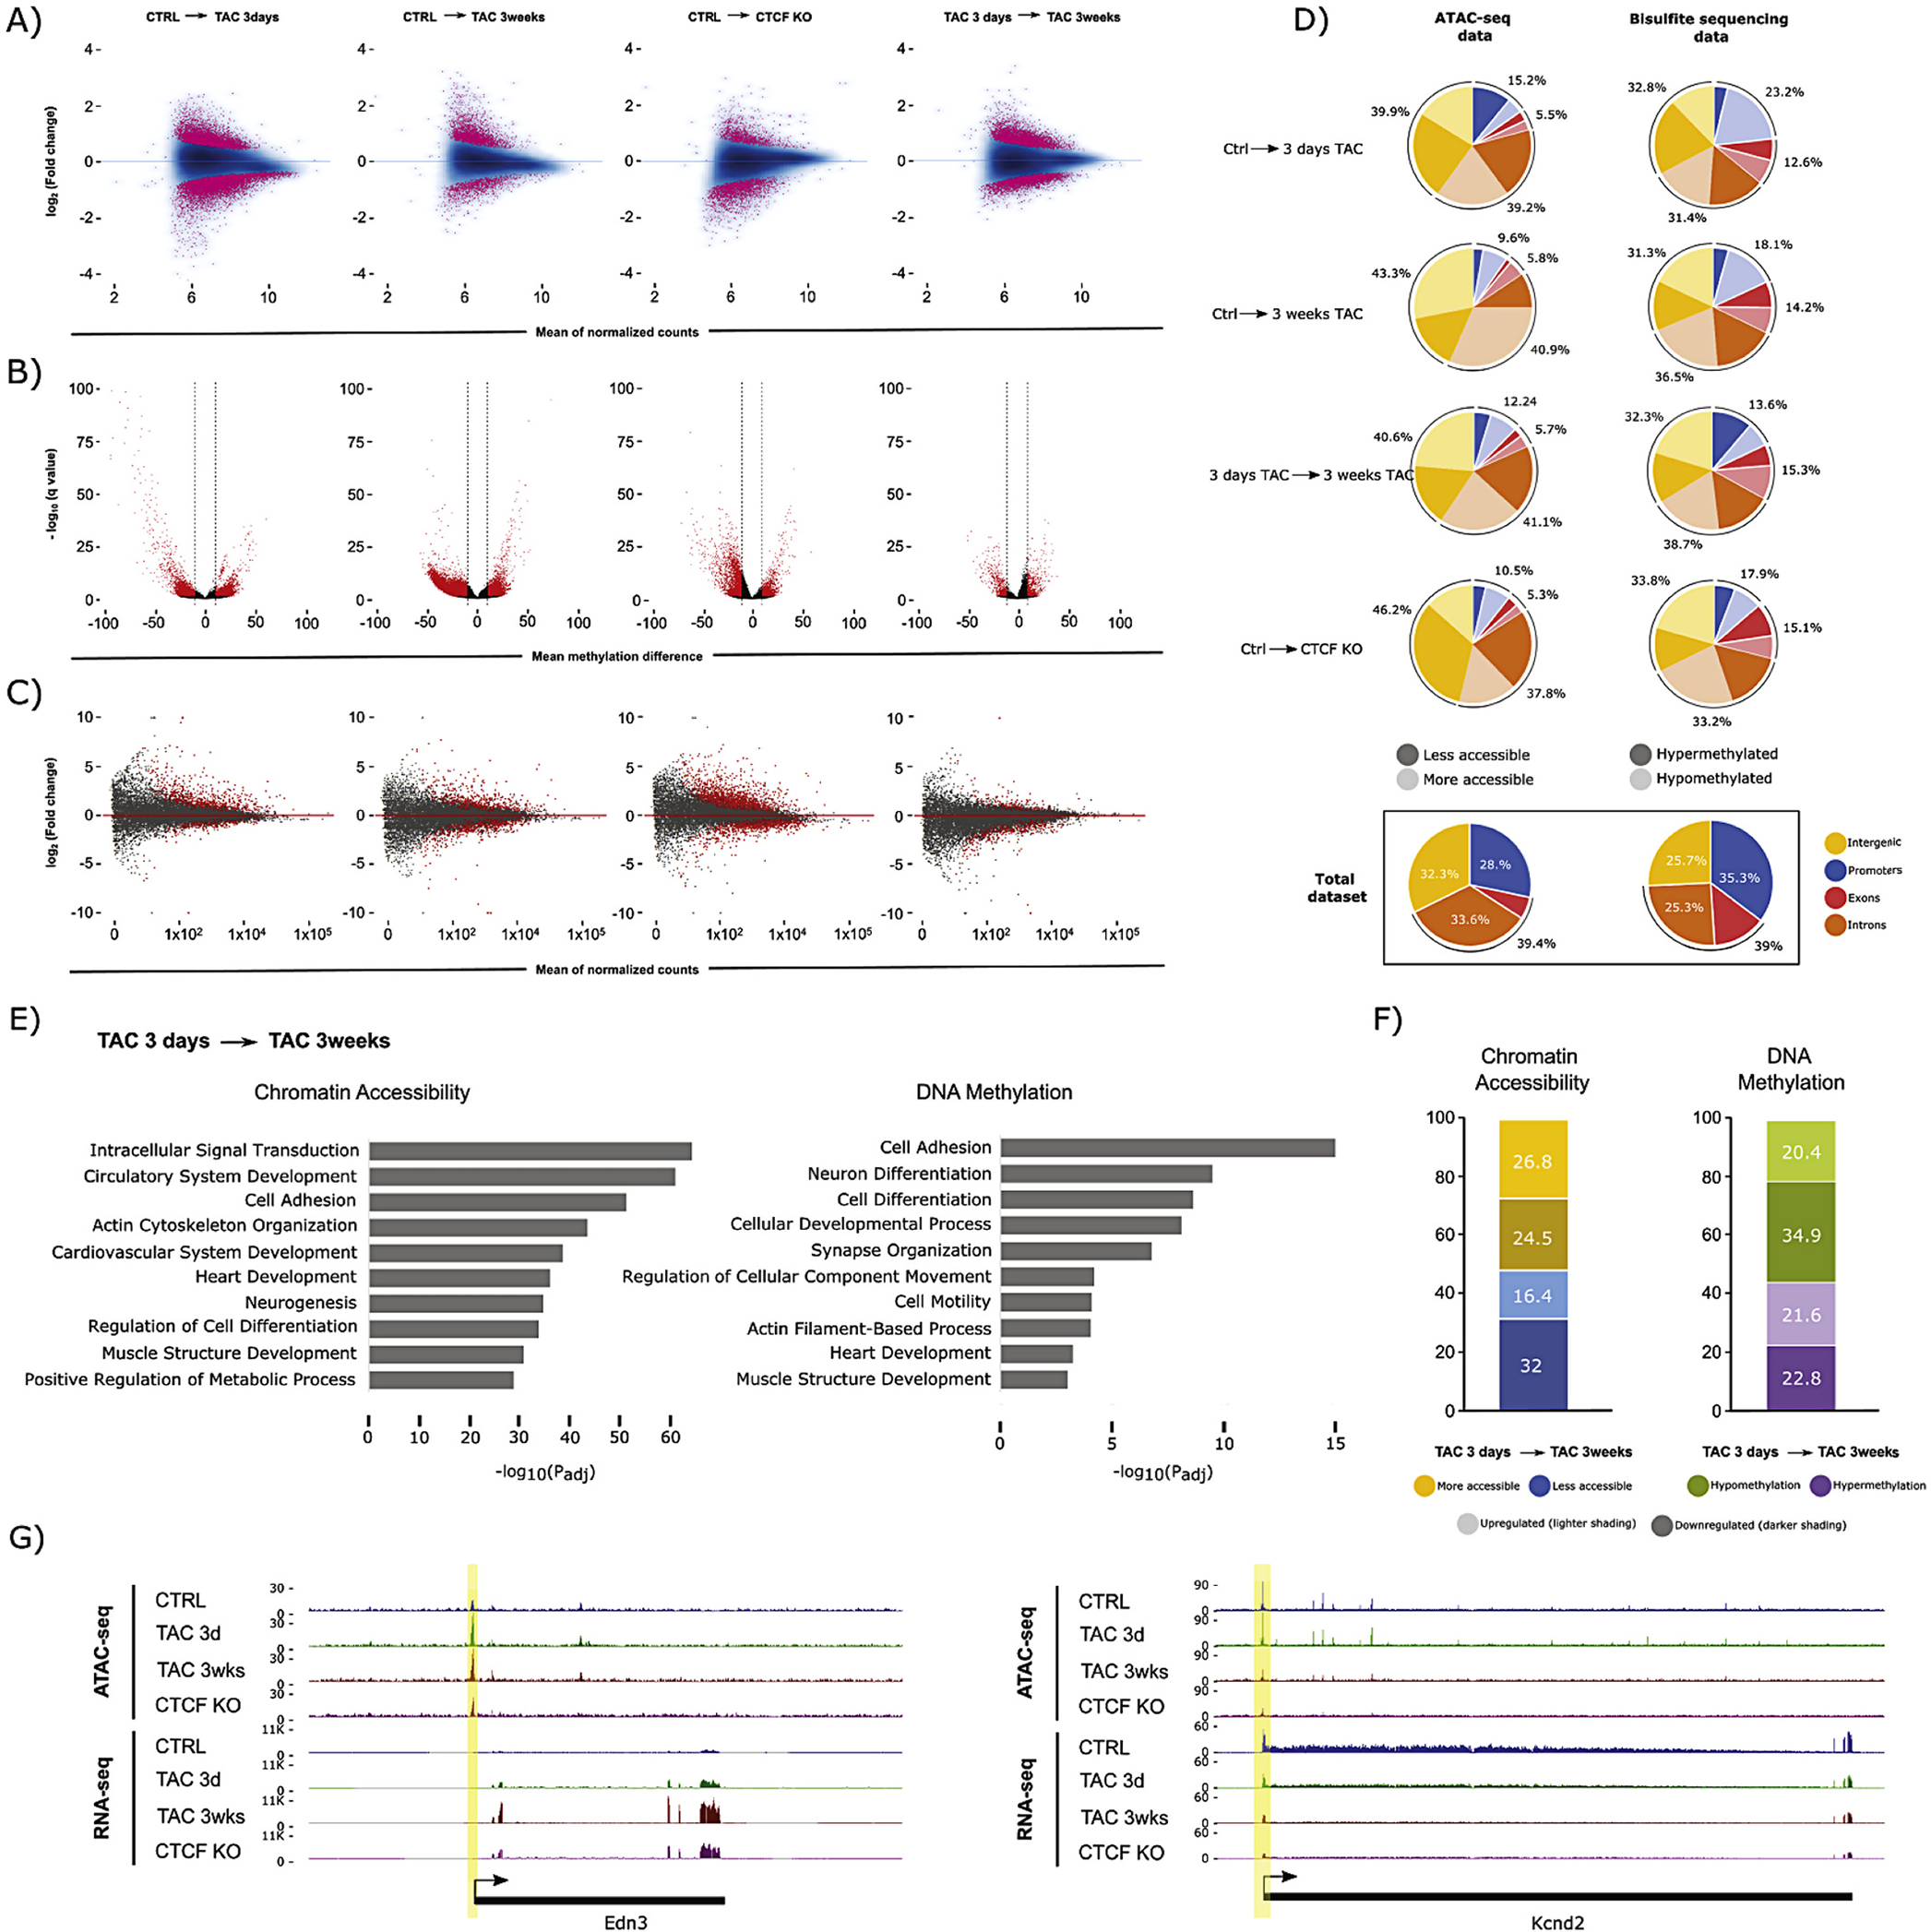
Fig. 1.

Chromatin accessibility, DNA methylation, and gene expression dynamics during heart failure. (A) Chromatin accessibility (ATAC-seq) MA plots comparing CTRL with 3 days TAC, 3 weeks TAC, and CTCFKO, (n = 3 animals per biological condition). The difference between 3 days and 3 weeks TAC is also shown. Pink dots indicate peaks with significant change in accessibility (FDR < 0.05). (B) DNA methylation (RRBS) volcano plots showing differentially methylated CpG sites (red, average DNA methylation difference > 10% and q-value <0.05) between conditions, (n = 3 animals per biological condition). (C) Gene expression (RNA-seq) MA plots for the same comparisons as in (A), (n = 3 animals per biological condition). Each dot represents an annotated transcript. Grey dots reflect no significant change. Red dots represent transcripts with adjusted p-value <0.05 (D) Differentially accessible peaks and differentially methylated CpGs occur preferentially in intergenic and intronic regions (top 4 pie charts) as judged by comparison to the total set of measured peaks and CpGs in our datasets (bottom pie charts). Promoter/exon/intron/intergenic distribution of differentially accessible ATAC-seq peaks (left) after 3 days TAC, 3 weeks TAC, and CTCFKO, in addition to the comparison between 3 days and 3 weeks TAC. Dark and light coloring indicates less and more accessibility, respectively. Right, Pie charts showing distribution of hypo- and hypermethylated CpGs in darker and lighter shading, respectively. Promoter regions were defined as −2000 to +200 bp from the transcription start site. (E) Gene ontology analysis of genes plus promoters (genes+2000 bp) that overlapping differentially accessible peaks (left) and differentially methylated CpGs (right) between 3 days and 3 weeks TAC. Terms associated with cardiovascular processes such as heart development, cytoskeletal and neuronal organization were significantly enriched when we study changes in chromatin accessibility (left) and DNA methylation (right). The x-axis indicates −logl0(adjusted p-value) for the analysis. (F) Charts indicating significant expression change (padj <0.05) for genes undergoing differential chromatin accessibility (left, FDR < 0.05) or DNA methylation (right, methylation difference > 10% and q-value <0.05). Left, Blue and yellow coloring indicate decrease and increase in chromatin accessibility between 3 days and 3 weeks TAC, respectively. Right, green and purple colour indicate hypo- and hypermethylation, respectively. For both stacked bar charts, shading indicates up- (lighter) or downregulation (darker) at the transcript level, respectively. (G) Browser tracks of genes that have change in chromatin accessibility between 3 days and 3 weeks TAC. Each track contains a combined signal from 3 replicates for each condition. Example loci showing increase in chromatin accessibility and transcription (Edn3, encoding Endothelin-3, a member of the endothelin family implicated in cardiovascular disease [57], left), and decrease in accessibility and transcription (Kcnd2, encoding Potassium voltagegated channel subfamily D member 2 which is associated with sudden cardiac death [58], right). (For interpretation of the references to colour in this figure legend, the reader is referred to the web version of this article.)
