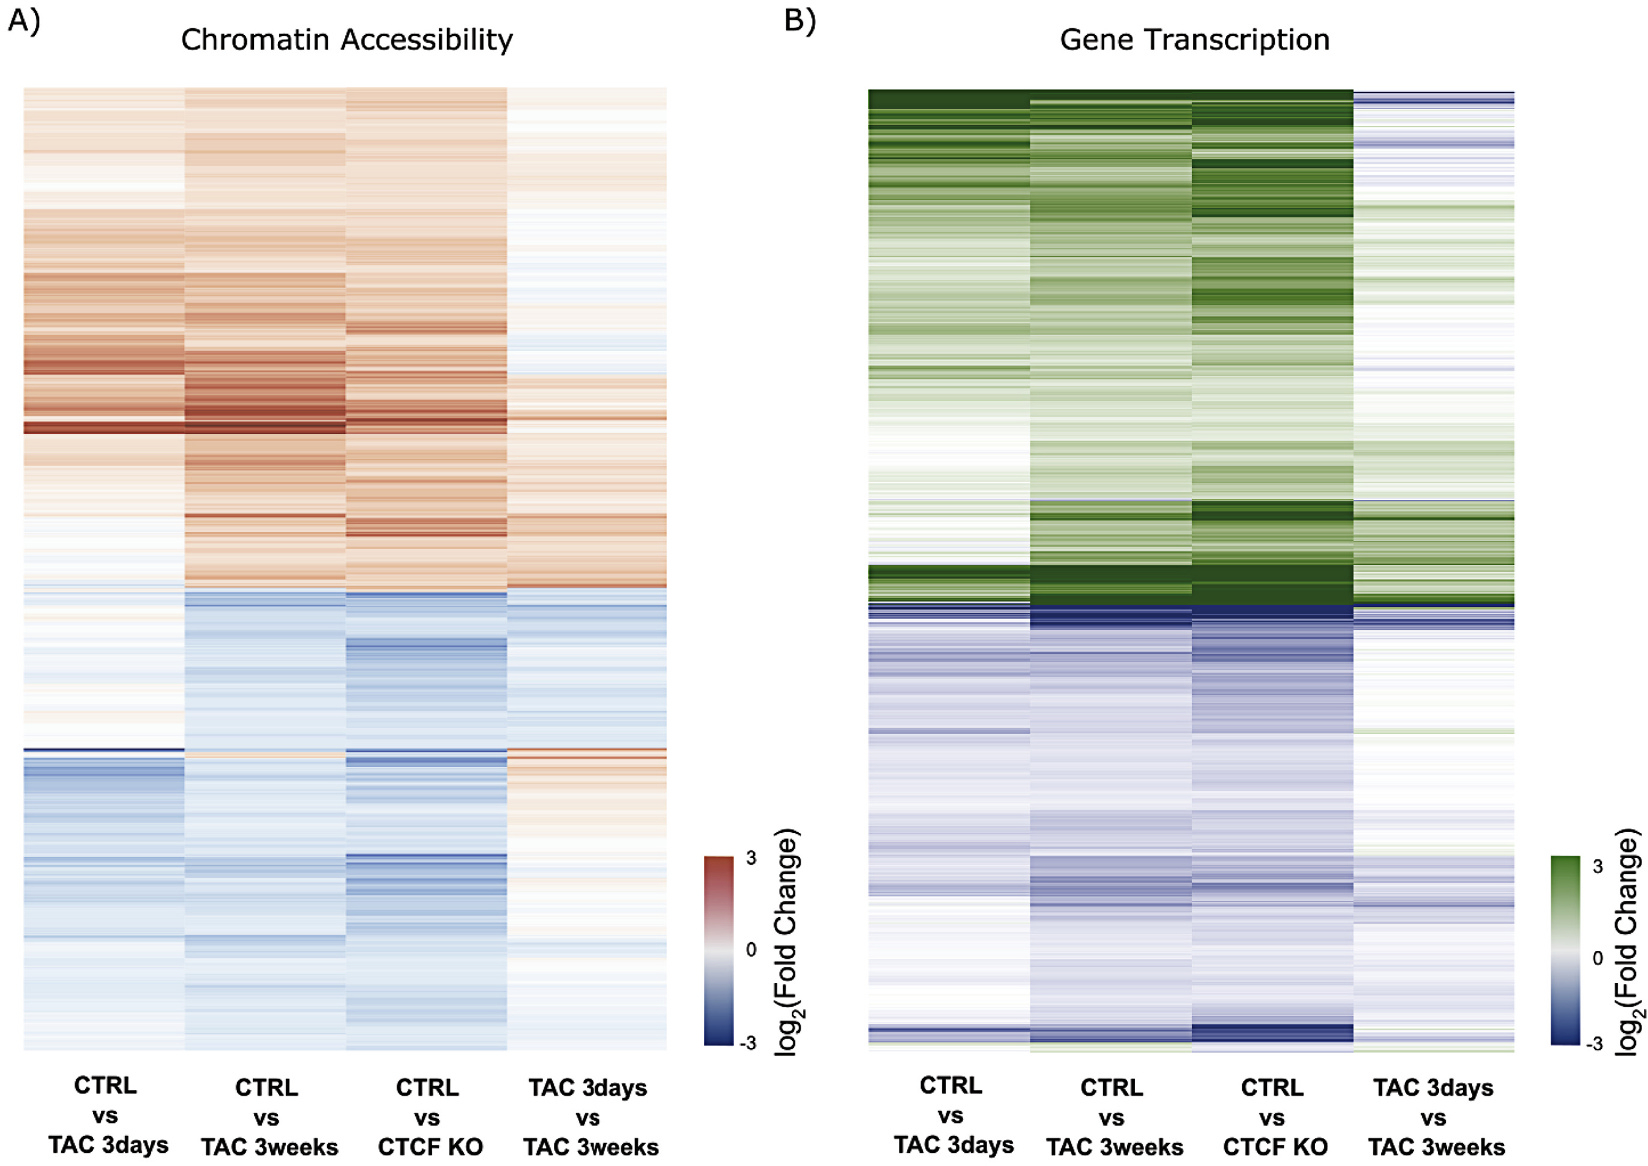
Fig. 3.

Transcription and accessibility change with chronic pathology are preceded by subtle architectural and transcriptional changes during acute perturbation. (A) Heatmap showing log2(Fold Change) of ATAC-seq peaks with significant change in chromatin accessibility (FDR < 0.05) at 3 weeks TAC and with CTCFKO. Accessibility changes occurring in late stage disease are preceded by minor changes during early pathology (1st column) that progress toward late stage disease (4th column shows continuation from 3 days to 3 weeks TAC). Red and blue coloring denote increase and decrease in accessibility, respectively. (B) Heatmap of log2(Fold Change) in transcription of differentially expressed genes (padj <0.05) at 3 weeks TAC and with CTCFKO when compared to Control. Green colour denotes upregulation of transcripts in treatment while blue denotes downregulation of mRNA levels. As in (A) changes that occur in later stages of pathology are not fully established by 3 days TAC (1st column), yet they progress from early to late pathology (4th column shows progression from 3 days to 3 weeks TAC), suggesting a time dependent shift in transcription with chronic pressure overload or CTCFKO. Panels (A) and (B) highlight progressive changes that result in significantly differential accessibility and transcription at late-stage pathology. (For interpretation of the references to colour in this figure legend, the reader is referred to the web version of this article.)
