
Fig. 4.
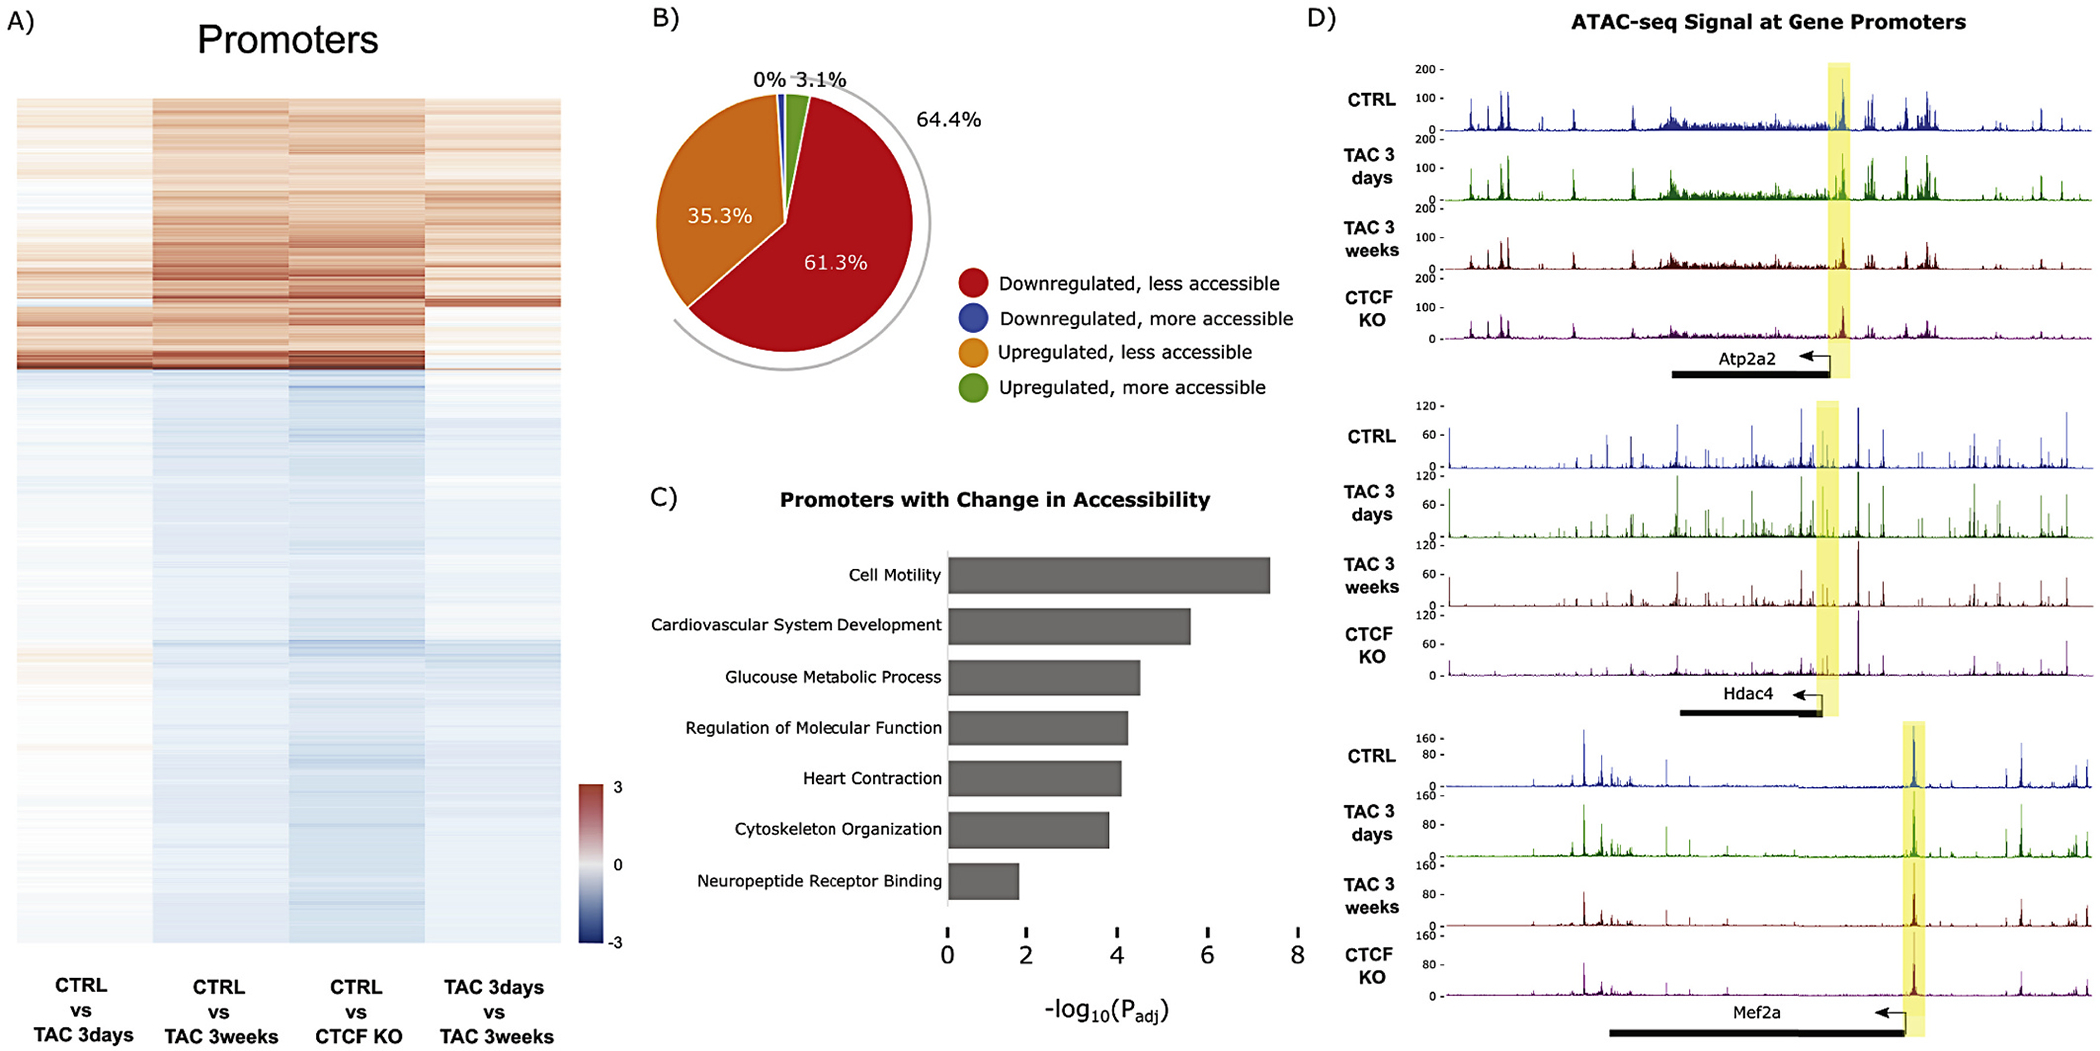
Promoter accessibility dynamics with pressure overload and CTCFKO. (A) Heatmap showing promoters with significant change (FDR < 0.05) in chromatin accessibility after 3 weeks TAC and with CTCFKO when compared to Control. Promoter accessibility dynamics with chronic pressure overload and long-term CTCF depletion are preceded by subtler changes during early/acute pathology (1st column) that progress into late pathology (further progression shown in 4th column, resulting in the sustained differences observed in 2nd and 3rd columns). Red and blue coloring denote gain and loss of accessibility, respectively. This panel highlights the gradual promoter accessibility changes at 3 days TAC that become significant at 3 weeks. (B) Pie chart summarizing the subset of promoters from (A) with significant (FDR < 0.05) change in chromatin accessibility and in transcription (padj <0.05) in both 3 weeks TAC and with CTCFKO. (C) Gene ontology analysis showing significant terms related to promoters with differential accessibility (FDR < 0.05) in 3 weeks TAC and with CTCFKO. The x-axis indicates -log10(adjusted p-value) for the analysis. (D) Chromatin accessibility tracks showing decreases in accessibility between control (blue), 3 days TAC (green), 3 weeks TAC (red) and CTCF depletion (purple) at the Atp2a2, Hdac4 and Mef2a loci (expression of all three genes are downregulated at early and late stage disease). Each track contains a combined signal from 3 replicates for each condition. (For interpretation of the references to colour in this figure legend, the reader is referred to the web version of this article.)