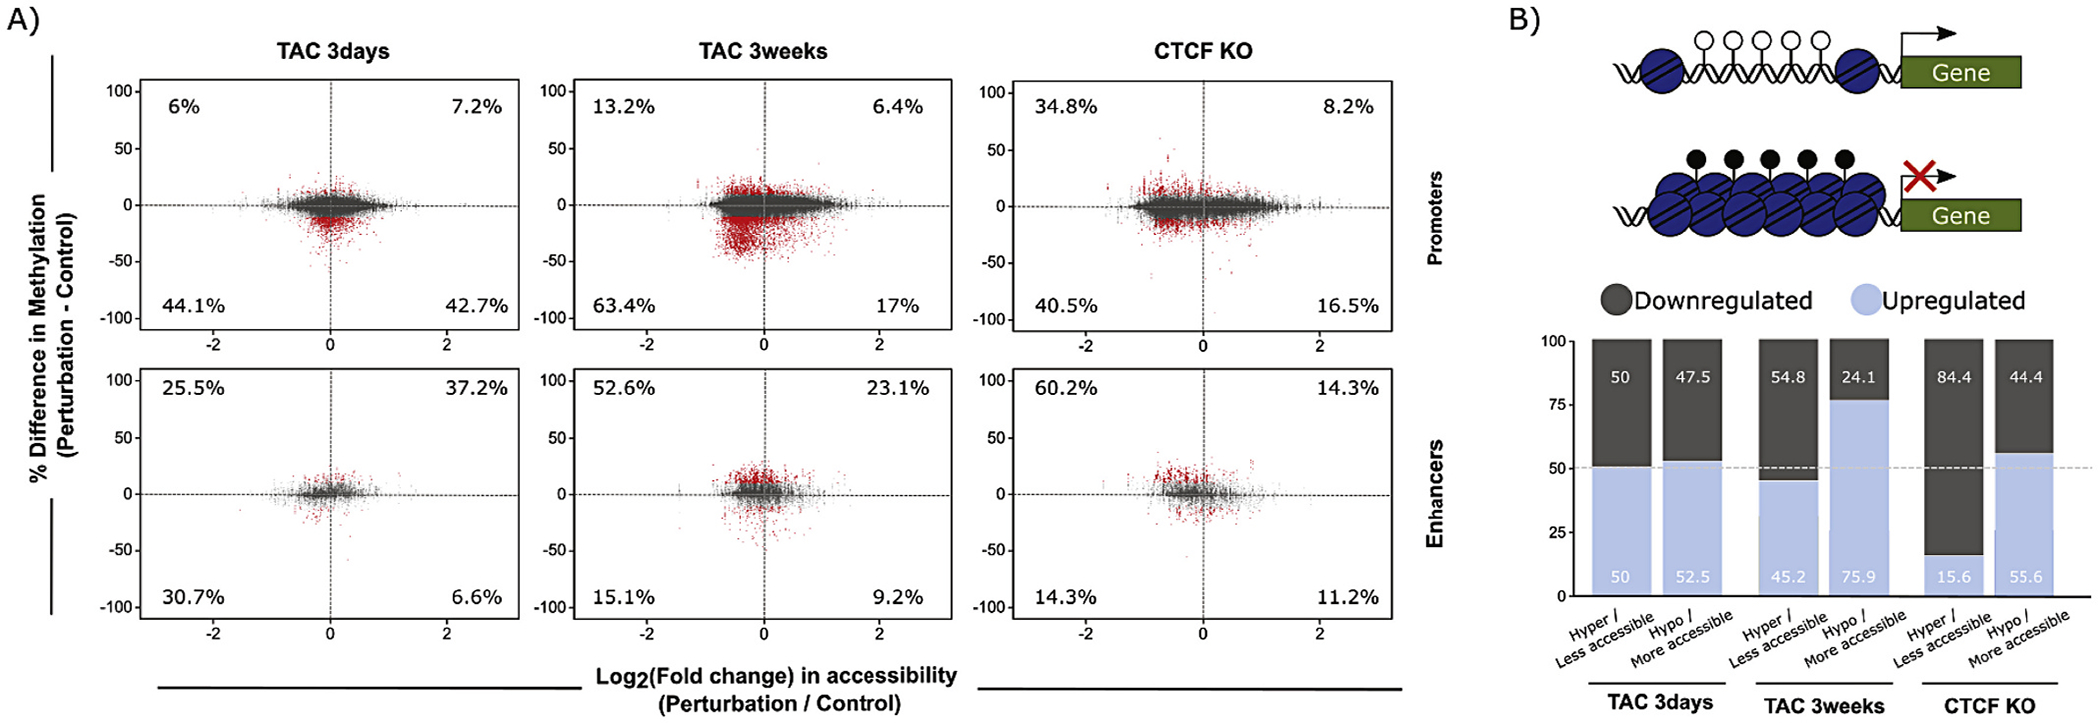
Fig. 6.

Integration of DNA methylation and chromatin accessibility data at promoters and enhancers. (A) DNA methylation and ATAC-seq integration charts, showing percent change in DNA methylation (y-axis) and log2(Fold Change) of chromatin accessibility (x-axis) of CpGs in promoters (top), and enhancers (bottom). Changes with 3 days TAC (left), 3 weeks TAC (center), and CTCFKO (right) are shown. Numbers within the charts indicate percentage of significantly differentially methylated CpGs (red points, average methylation difference > 10% and q-value <0.05) within each quadrant that overlap with regions of significant change in chromatin accessibility (FDR < 0.05). These findings demonstrate that the relationship between accessibility and DNA methylation varies between different regulatory elements (enhancers and promoters), suggesting the involvement of distinct epigenetic mechanisms at these different regulatory elements to determine their involvement in transcription. (B) Percent of up- and downregulated genes detected in the promoter analysis in (A). Top, hypothesis diagram showing a more accessible, hypomethylated promoter, and higher downstream transcription, or less accessible, hypermethylated promoter with no transcription. Bottom, summary charts indicating percent up- (lighter) and downregulated (darker shading) genes whose promoters underwent accessibility and methylation changes shown in top diagram. (For interpretation of the references to colour in this figure legend, the reader is referred to the web version of this article.)
