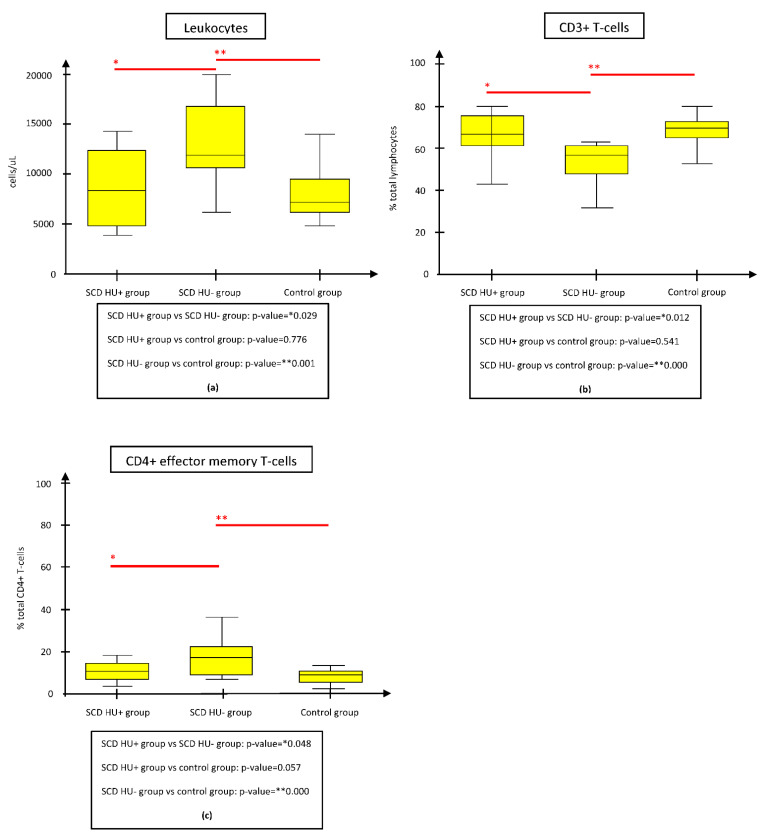
Figure 1.
Comparison of immunologic parameters between the SCD HU− and HU+ groups, the SCD HU− and control groups, and the SCD HU+ and control groups. The figure shows only the parameters whose difference resulted statistically significant both between SCD HU- and HU+ groups and between SCD HU- and control groups. (a) Mean WBC absolute count was significantly reduced in SCD HU+ subgroup and controls respect to SCD HU- subgroup. (b) Mean CD3+ T-cell% count was significantly augmented in SCD HU+ subgroup and controls respect to SCD HU- subgroup. (c) Mean CD4+ effector memory T-cell% count was significantly lower in SCD HU+ subgroup and controls respect to SCD HU- subgroup. Abbreviations: HU, hydroxyurea; SCD, Sickle cell disease.

